Auto Insurance in Phoenix, Arizona [Can’t-Miss Guide]
Free Auto Insurance Comparison
Enter your ZIP code below to compare auto insurance rates.
![]() Secured with SHA-256 Encryption
Secured with SHA-256 Encryption
Jeff Root
Licensed Insurance Agent
Jeff is a well-known speaker and expert in insurance and financial planning. He has spoken at top insurance conferences around the U.S., including the InsuranceNewsNet Super Conference, the 8% Nation Insurance Wealth Conference, and the Digital Life Insurance Agent Mastermind. He has been featured and quoted in Nerdwallet, Bloomberg, Forbes, U.S. News & Money, USA Today, and other leading fina...
Licensed Insurance Agent
UPDATED: Nov 27, 2023
It’s all about you. We want to help you make the right coverage choices.
Advertiser Disclosure: We strive to help you make confident insurance decisions. Comparison shopping should be easy. We partner with top insurance providers. This doesn’t influence our content. Our opinions are our own.
Editorial Guidelines: We are a free online resource for anyone interested in learning more about auto insurance. Our goal is to be an objective, third-party resource for everything auto insurance related. We update our site regularly, and all content is reviewed by auto insurance experts.
| PHOENIX CITY STATISTICS | DETAILS |
|---|---|
| City Population | 1,626,078 |
| City Density | 3,424 people per square mile |
| Average Cost of Car Insurance in Phoenix | $4,765.52 |
| Cheapest Car Insurance Company | USAA + Geico |
| Road Conditions | Poor Share: 23% Mediocre Share: 29% Fair Share: 20% Good Share: 27% Vehicle Operating Costs: $550 |
Have you been spending valuable time searching high and low for the perfect car insurance policy? Have you plugged your information into a bunch of different websites promising to give you the cheapest car insurance quote out there?
Did you become a telemarketer slave to a website that generates your number to many car insurance vendors that never stop calling you, even after you have car insurance?
If you answered “yes” to any of these questions, you’ve come to the right place.
There aren’t any boxes asking for your third pet’s name from 1996, and we aren’t going to ask for your phone number. Not at all.
If you have just 15 short minutes, we’ll walk you through all the information you need about car insurance in Phoenix, Arizona.
To save you time and money, we’ve collaborated with some of the most trustworthy sources to bring you the most accurate information about car insurance in Phoenix, Arizona.
These sources include the FBI, the National Association of Insurance Commissioners, the Insurance Institute for Highway Safety, and more.
From car insurance costs to Phoenix crash statistics, we have it all.
Do you want to start saving money on your insurance policy right now? Use our free tool by entering your zip code into this box to get started.
Cheapest Car Insurance in Phoenix
We know that the cost of car insurance is an important deal-breaker for most people when choosing a policy, so we want to get straight to the point.
How much does car insurance actually cost?
We want to be straight up with you; we can’t solve the question with just one answer. Car insurance rates are based on many different factors.
But, what are those factors?
Tune in as we discuss below.
Car Insurance Rates: Male vs. Female vs. Age
Did you know that your age, gender, and marital status can affect your car insurance rate? Watch the short video below to learn more.
Based on a recent study by Data USA, the median age in Phoenix, Arizona, is 33.8 years of age. This is good news because it tells us most drivers in the city won’t be charged more than the average driver in the U.S.
Generally, drivers with a clean record who are over the age of 25 save a significant amount of money on their car insurance policy.
Let’s take a closer look at how age can affect a car insurance rate in the table below.
| Age | 35 | 60 | 17 | 25 | Cheapest Rate | Cheapest Age |
|---|---|---|---|---|---|---|
| Average Annual Rate | $2,966.21 | $2,747.78 | $10,105.79 | $3,384.84 | $2,747.78 | $60.00 |
As you can see from the table above, young drivers typically pay the most money for car insurance. As you get older, and if you keep a clean record, your rate drastically drops in cost.
We also see that drivers who are 60 years old usually pay the least amount of money for car insurance. This could be attributed to the fact that older drivers have a lot of driving experience and are less likely to cause an accident.
Besides your age, gender can also influence your insurance rate. Check out the video below.
According to Quadrant Data Solutions, on average, in Phoenix, Arizona, men pay $4,801.15 per year for car insurance while women pay $4,533.75 per year for the same policy.
This means that men pay about $270 more per year for car insurance in Phoenix, Arizona, that women do.
But why?
Even though it’s completely unethical, car insurance companies often deem females as more responsible drivers than males.
Let’s put these three stats (age, gender, and marital status) together and see what the results are.
| Demographic | Rate |
|---|---|
| Married 60-year old female | $2,697.88 |
| Married 60-year old male | $2,797.67 |
| Married 35-year old female | $2,961.25 |
| Married 35-year old male | $2,971.16 |
| Single 25-year old female | $3,235.53 |
| Single 25-year old male | $3,534.14 |
| Average | $4,801.15 |
| Single 17-year old female | $9,240.33 |
| Single 17-year old male | $10,971.25 |
This table above shows us that married, 60-year-old females usually have the cheapest car insurance rate. Married couples usually have less expensive rates than singles do because they are also considered to be more responsible and less reckless when behind the wheel.
On the other hand, single 17-year-old males pay the most money for car insurance.
Don’t be discouraged by these statistics — there are many more factors that go into deciding a car insurance rate.
Don’t go anywhere, those factors are coming up next.
Cheapest ZIP Codes in Phoenix
Did you know that the cost of car insurance in Phoenix, Arizona, could also be influenced by where you live?
That’s right. Costs could vary based on crime rates and the frequency of natural disasters.
Take a look at the different costs of car insurance arranged by ZIP codes in Phoenix. Find your ZIP code in the table below.
| ZIP Code | Average Annual Rate |
|---|---|
| 85003 | $4,961.45 |
| 85004 | $4,987.28 |
| 85006 | $5,049.71 |
| 85007 | $4,983.98 |
| 85008 | $4,785.75 |
| 85009 | $5,433.92 |
| 85012 | $4,990.24 |
| 85013 | $5,013.46 |
| 85014 | $4,811.87 |
| 85015 | $5,153.56 |
| 85016 | $4,710.99 |
| 85017 | $5,394.22 |
| 85018 | $4,615.79 |
| 85019 | $5,327.55 |
| 85020 | $4,825.63 |
| 85021 | $5,073.14 |
| 85022 | $4,550.49 |
| 85023 | $4,749.20 |
| 85024 | $4,489.60 |
| 85025 | $4,961.06 |
| 85026 | $4,738.00 |
| 85027 | $4,406.90 |
| 85028 | $4,477.01 |
| 85029 | $4,957.12 |
| 85031 | $5,297.78 |
| 85032 | $4,556.05 |
| 85033 | $5,179.81 |
| 85034 | $5,035.29 |
| 85035 | $5,185.54 |
| 85037 | $4,750.51 |
| 85039 | $4,500.91 |
| 85040 | $5,084.77 |
| 85041 | $5,069.50 |
| 85042 | $4,847.26 |
| 85043 | $4,999.24 |
| 85044 | $4,181.43 |
| 85045 | $4,204.17 |
| 85048 | $4,138.67 |
| 85050 | $4,345.58 |
| 85051 | $5,106.96 |
| 85053 | $4,686.83 |
| 85054 | $4,407.98 |
| 85065 | $4,676.64 |
| 85073 | $4,788.65 |
| 85083 | $4,285.29 |
| 85085 | $4,129.51 |
| 85086 | $4,053.68 |
| 85087 | $4,090.25 |
| 85097 | $4,460.05 |
The table above shows that there’s almost a $1,500 difference from the cheapest ZIP code rate to the most expensive rate.
That’s a pretty significant difference considering all of these ZIP codes are in the same exact city.
What’s the best car insurance company in Phoenix?
When you’re considering an insurance rate from a specific company, it’s important to remember that not all car insurance companies are created equal.
While one rate from one car insurance company might be influenced more by place of residence, another rate from another company might be influenced more by a person’s credit score or driving record.
While assessing which car insurance company to insure you, it’s important to always look at the big picture, but sometimes this is easier said than done.
To save you time and confusion, we’ve already done all of the leg work for you — we’ve included information in this section like cheapest rates by company, rates based on driving record, commute, credit score, and so much more.
Cheapest Car Insurance Rates by Company
This table indicates the car insurance companies that charge the cheapest coverage rates in Phoenix, Arizona.
| Group | Married 35-year old female | Married 35-year old male | Married 60-year old female | Married 60-year old male | Single 17-year old female | Single 17-year old male | Single 25-year old female | Single 25-year old male | Average |
|---|---|---|---|---|---|---|---|---|---|
| Allstate | $4,419.60 | $4,419.60 | $4,306.76 | $4,306.76 | $9,466.11 | $12,191.84 | $4,925.16 | $5,341.70 | $6,172.19 |
| American Family | $3,264.65 | $3,264.65 | $2,998.24 | $2,998.24 | $8,649.73 | $11,311.59 | $3,264.65 | $3,820.35 | $4,946.51 |
| Farmers | $3,488.67 | $3,491.25 | $3,092.54 | $3,300.20 | $15,434.42 | $16,048.47 | $3,945.24 | $4,071.95 | $6,609.09 |
| Geico | $1,944.75 | $2,172.44 | $1,658.73 | $2,135.01 | $5,622.93 | $5,896.33 | $1,765.35 | $1,721.86 | $2,864.68 |
| Nationwide | $3,055.09 | $3,109.12 | $2,723.37 | $2,888.14 | $7,705.85 | $9,890.36 | $3,542.35 | $3,835.44 | $4,593.72 |
| Progressive | $2,452.83 | $2,128.39 | $2,197.51 | $2,087.34 | $10,127.71 | $11,275.34 | $2,621.26 | $2,581.25 | $4,433.95 |
| State Farm | $3,770.00 | $3,770.00 | $3,337.79 | $3,337.79 | $11,885.08 | $14,939.62 | $4,058.40 | $5,133.79 | $6,279.06 |
| Travelers | $2,399.40 | $2,526.29 | $2,233.39 | $2,376.04 | $7,161.63 | $9,051.98 | $2,542.13 | $2,673.68 | $3,870.57 |
| USAA | $1,856.29 | $1,858.69 | $1,732.63 | $1,749.52 | $7,109.49 | $8,135.68 | $2,455.27 | $2,627.25 | $3,440.60 |
If you look at the table above, you’ll notice that USAA, Travelers, and Geico have the cheapest rates out of any of the companies listed.
As we discussed in the previous section, this table also confirms that single, 17-year-old males tend to pay the highest rate for car insurance.
When you’re looking at this table, make sure you pick out the average rates for your demographic, not just the cheapest rates on the table.
Best Car Insurance for Commute Rates
According to the Federal Highway Administration’s 2014 Licensed Drivers By State report, Arizona drivers drove an average of 12,829 miles in the state that year.
This table below shows average rates based on commute miles driven.
| Group | 10 miles commute. 6000 annual mileage. | 25 miles commute. 12000 annual mileage. | Average |
|---|---|---|---|
| Allstate | $6,172.19 | $6,172.19 | $6,172.19 |
| American Family | $4,899.30 | $4,993.72 | $4,946.51 |
| Farmers | $6,609.09 | $6,609.09 | $6,609.09 |
| Geico | $2,815.81 | $2,913.54 | $2,864.68 |
| Nationwide | $4,593.71 | $4,593.71 | $4,593.71 |
| Progressive | $4,433.95 | $4,433.95 | $4,433.95 |
| State Farm | $6,117.42 | $6,440.69 | $6,279.06 |
| Travelers | $3,870.57 | $3,870.57 | $3,870.57 |
| USAA | $3,403.62 | $3,477.59 | $3,440.61 |
This table reveals that while some companies charge the same rate across the board, other companies charge $50-$100 more if you drive more miles per year.
If you drive more than the average person does per year, you might want to check out progressive.
Best Car Insurance for Coverage Level Rates
Coverage level is very important when choosing a car insurance policy. Your coverage level determines how much money you’ll have to pay out of pocket when you get into an accident.
Some car insurance companies might give you a break on your rate if you choose a higher coverage level. See the table below.
| Group | High | Low | Medium | Average |
|---|---|---|---|---|
| Allstate | $6,593.61 | $5,711.69 | $6,211.28 | $6,172.19 |
| American Family | $4,975.42 | $4,760.14 | $5,103.98 | $4,946.51 |
| Farmers | $7,602.03 | $5,542.42 | $6,682.83 | $6,609.09 |
| Geico | $3,322.45 | $2,360.09 | $2,911.48 | $2,864.67 |
| Nationwide | $4,773.24 | $4,360.28 | $4,647.62 | $4,593.71 |
| Progressive | $4,940.49 | $3,837.15 | $4,524.22 | $4,433.95 |
| State Farm | $6,816.24 | $5,615.20 | $6,405.74 | $6,279.06 |
| Travelers | $4,249.42 | $3,425.94 | $3,936.34 | $3,870.57 |
| USAA | $3,670.71 | $3,160.54 | $3,490.56 | $3,440.60 |
For just a few hundred dollars more per year, you can go from having low coverage insurance to high coverage insurance. This could mean the difference from having minimum liability insurance to comprehensive coverage.
Having higher coverage could cost you as little as $50 more per month and could save you thousands of dollars in the long run.
Best Car Insurance for Credit History Rates
Credit history is another factor that can influence your car insurance rate.
Except for a few states in the country where the practice is illegal, many car insurance carriers will use your credit history as a determining factor when evaluating your car insurance rate.
Check out the table below.
| Group | Fair | Good | Poor | Average |
|---|---|---|---|---|
| Allstate | $5,618.05 | $5,025.29 | $7,873.23 | $6,172.19 |
| American Family | $4,632.34 | $3,993.23 | $6,213.97 | $4,946.51 |
| Farmers | $6,309.77 | $6,000.67 | $7,516.84 | $6,609.09 |
| Geico | $2,579.19 | $2,067.82 | $3,947.01 | $2,864.67 |
| Nationwide | $4,397.66 | $3,839.02 | $5,544.47 | $4,593.72 |
| Progressive | $4,318.99 | $4,032.59 | $4,950.28 | $4,433.95 |
| State Farm | $4,471.16 | $2,796.19 | $11,569.83 | $6,279.06 |
| Travelers | $3,839.59 | $3,056.90 | $4,715.22 | $3,870.57 |
| USAA | $3,164.45 | $2,635.49 | $4,521.87 | $3,440.60 |
As you can see, if you have bad credit, your rate can potentially increase by thousands of dollars.
Check out State Farm’s rate: if you have poor credit, they will hike up your rate from $2,796.19 to $11,569.83. In general, people with poor credit are usually less responsible — less responsible drivers and less likely to pay their bills on time.
Best Car Insurance for Driving Record Rates
The most significant factor to influence your car insurance rate is your driving record. After all, you are signing up with a company that is going to assess how much of a potential risk you are.
The table below reveals exactly how much your rates could change based on your driving record alone.
| Group | Clean record | With 1 accident | With 1 DUI | With 1 speeding violation | Average |
|---|---|---|---|---|---|
| Allstate | $4,944.22 | $6,260.76 | $7,084.42 | $6,399.37 | $6,096.47 |
| American Family | $3,525.12 | $5,384.00 | $6,785.55 | $4,091.37 | $5,231.56 |
| Farmers | $5,583.15 | $7,211.81 | $7,037.94 | $6,603.47 | $6,610.97 |
| Geico | $2,207.41 | $3,003.89 | $4,039.99 | $2,207.41 | $3,083.76 |
| Nationwide | $3,872.83 | $4,077.56 | $6,081.05 | $4,343.42 | $4,677.15 |
| Progressive | $3,903.29 | $5,165.24 | $4,121.89 | $4,545.39 | $4,396.81 |
| State Farm | $5,700.86 | $6,857.25 | $6,279.06 | $6,279.06 | $6,279.06 |
| Travelers | $3,086.93 | $4,032.98 | $4,509.47 | $3,852.89 | $3,876.46 |
| USAA | $2,497.98 | $3,589.97 | $4,732.04 | $2,942.41 | $3,606.66 |
These companies don’t mess around with drivers who violate the law. If you get a speeding ticket or are convicted of a DUI, your rates will increase by thousands of dollars per year.
On the other hand, if you get into an accident, Geico might only raise your rate by $700 per year. This is on the lower side, considering some car insurance companies on this list might raise your rate by almost $2,000 more per year after an accident.
Car Insurance Factors in Phoenix
Don’t go away just yet — there are still many more factors that can affect the cost of car insurance in Phoenix, Arizona.
We’ve partnered with Data USA and a few other websites to bring you the important information listed below.
Metro Report – Growth & Prosperity
Let’s take a look at the growth and prosperity in Phoenix, Arizona, in the Brookings Metro Report.
Prosperity:
- Productivity: + 0.5 percent (67th of 100)
- Standard of Living: + 1.4 percent (58th of 100)
- Average Annual Wage: + 1.2 percent (38th of 100)
Growth:
- Jobs: + 2.8 percent (12th of 100)
- Gross Metropolitan Product (GMP): + 3.3 percent (23rd of 100)
- Jobs at Young Firms: + 7.9 percent (16th of 100)
From 2016-2017, Phoenix, Arizona, saw a huge increase in both areas of prosperity and growth.
Median Household Income
You should know now that insurance isn’t cheap — but what is the annual median household income in Phoenix, Arizona?
According to Data USA, the median household income in Phoenix is $56,696.
Phoenix’s median household income was under the median nationwide annual income of $60,336; however, it did increase by 8.9 percent from 2016 to 2017.
But what does all this have to do with insurance premiums?
The average cost of car insurance in Phoenix, Arizona, is $4,765.52. This means that the average driver living in Phoenix spends an average of 8.4 percent of their annual income per year on car insurance alone.
How much of your current income is spent on car insurance?
Homeownership in Phoenix
You might not think of it this way, but owning a home can help you save money on your car insurance policy.
Car insurance companies believe drivers who own a home are more responsible in general and are more likely to pay their bills every month and on time.
Many car insurance companies will even offer you a discount if you bundle your homeowners insurance with your car insurance policy.
In 2017, 56.1 percent of the housing units in Phoenix, Arizona, were occupied by their owners. This percentage grew from the previous year’s rate of 53 percent. This percentage of owner-occupation is lower than the national average of 63.9 percent.
In the same year, the median property value in Phoenix grew to $231,000 from the previous year’s value of $213,300.
Education in Phoenix
Phoenix has several great universities for students to attend. In 2016, universities in Phoenix, Arizona, awarded 39,370 degrees.
The student population of Phoenix, Arizona, is skewed toward women, with 45,062 male students and 96,557 female students.
Based on the stats acquired by Data USA, the largest universities in Phoenix in terms of degrees conferred were Grand Canyon University, Arizona State University-Downtown Phoenix, and Phoenix College.
The number of graduates, as well as the percentage of total degrees the largest Phoenix educational institutions conferred in 2016, are as follows:
- Grand Canyon University: Graduates – 18,469, Degrees Conferred – 46.9 percent
- Arizona State University-Downtown Phoenix: Graduates – 3,342, Degrees Conferred – 8.49 percent
- Phoenix College: Graduates – 2,244, Degrees Conferred – 5.7 percent
Currently, the most popular majors in Phoenix by concentration and percentage of degrees awarded are:
- Registered Nursing: Degrees awarded – 6,830, Percentage of total degrees awarded – 17.3 percent
- General Business Administration & Management: Degrees awarded – 2,816, Percentage of total degrees awarded – 7.15 percent
- Liberal Arts & Sciences: Degrees awarded – 2,717, Percentage of total degrees awarded – 6.9 percent
General special education and teaching was another popular major in Phoenix, Arizona: 890 degrees were awarded in 2016.
The median tuition costs in Phoenix, Arizona, are $18,021 for private four-year colleges, and $9,442 and $25,140, respectively, for public four-year colleges for in-state students and out-of-state students.
Wage by Race & Ethnicity in Common Jobs
How do race and ethnicity affect the wage rate in Phoenix, Arizona?
Data USA says in 2017, the highest paid race/ethnicity of Arizona workers was Asian. These workers were paid 1.21 times more than white workers, who made the second-highest salary of any race/ethnicity.
But let’s take things a step further.
The table below indicates wages for common jobs based on race and ethnicity in Phoenix, Arizona, along with the percentage of those workers’ incomes going to auto insurance premiums.
| Ethnicity | Miscellaneous Managers | PERCENTAGE OF INCOME GOING TO CAR INSURANCE | Firstline supervisors of retailsales workers | PERCENTAGE OF INCOME GOING TO CAR INSURANCE | Customer Service Representatives | PERCENTAGE OF INCOME GOING TO CAR INSURANCE | Elementary + Middle School Teachers | PERCENTAGE OF INCOME GOING TO CAR INSURANCE | Cashiers | PERCENTAGE OF INCOME GOING TO CAR INSURANCE |
|---|---|---|---|---|---|---|---|---|---|---|
| Asian | $99,831 | 4.70% | $59,912 | 7.90% | $47,099 | 10.10% | $37,726 | 12.60% | $12,483 | 38.10% |
| White | $90,658 | 5.20% | $52,561 | 9% | $30,822 | 15.40% | $39,182 | 12.10% | $18,801 | 25.30% |
| American Indian | $82,090 | 5.80% | $30,992 | 15.30% | $30,306 | 15.70% | $42,089 | 11.30% | $16,590 | 28.70% |
| Other | $64,916 | 7.30% | $32,209 | 14.70% | $22,543 | 21.10% | $36,303 | 13.10% | $8,933 | 53.30% |
| Two or More Races | $52,890 | 9% | $61,580 | 7.70% | $18,594 | 25.60% | $37,011 | 12.80% | $12,058 | 39.50% |
| Black | $50,455 | 9.40% | $57,701 | 8.20% | $26,218 | 18.10% | $41,118 | 11.50% | $9,260 | 51.40% |
It’s pretty crazy to see the different wage rates for the same jobs. Some of the workers spend up to 50 percent or more of their yearly income on car insurance alone.
Even the highest-paid workers are paying as much as 38 percent of their salary on car insurance.
Wage by Gender in Common Jobs
The gender pay gap has been a hot topic for a long time now, and while some may say it doesn’t exist, the data doesn’t lie.
In 2017, full-time male employees in Arizona made 1.31 times more than female employees.
- Phoenix Female Average Salary: $47,801
- Phoenix Male Average Salary: $62,465
That’s more than a $14,000 wage gap between genders. The average annual cost of car insurance in Phoenix, Arizona, is $4,765.52.
According to our data, on average, women spend 9.9 percent of their yearly salary on car insurance, while men spend about 7.6 percent of their salary on car insurance.
Poverty by Age & Gender
Here are key trends to look for concerning age- and gender-based poverty rates.
There is 20.9 percent of the population for whom poverty status is determined in Phoenix, Arizona,(325,000 out of 1.56 million people) living below the poverty line, a number that is higher than the national average of 13.4 percent.
The largest demographic living in poverty are females 25-34, followed by females 35-44 and then males 6-11.
Poverty by Race & Ethnicity
According to Data USA, the most common racial or ethnic group living below the poverty line in Phoenix, Arizona, is white, followed by Hispanic and Other.
Here are the stats below:
- White: 214,305
- Hispanic: 202,681
- Other: 57,257
The Census Bureau uses a set of money income thresholds that vary by family size and composition to determine who classifies as impoverished.
If a family’s total income is less than the family’s threshold than that family and every individual in it is considered to be living in poverty.
Employment by Occupations
From 2016 to 2017, employment in Phoenix, Arizona, grew at a rate of 2.82 percent, from 770,000 employees to 792,000 employees.
The most common positions by the number of residents in Phoenix, Arizona, are as follows:
- Office & Administrative Support Occupations: 115,878 people
- Sales & Related Occupations: 85,989 people
- Management Occupations: 83,239 people
Compared to other places, Phoenix, Arizona, has an unusually high number of residents working as building and grounds occupations (1.47 times higher than expected), construction and extraction occupations (1.39 times), and material moving occupations (1.36 times).
Enter your ZIP code below to compare auto insurance rates.
![]() Secured with SHA-256 Encryption
Secured with SHA-256 Encryption
Driving in Phoenix
Driving through a city isn’t always a walk in the park. It’s important to know the best routes in your city to avoid traffic jams and road construction to get the most out of your gas mileage.
Up next, we talk about the best driving routes through Phoenix, Arizona.
Roads in Phoenix
From major highways, toll roads, popular sites, and more, we have all your Phoenix driving needs covered.
Major Highways
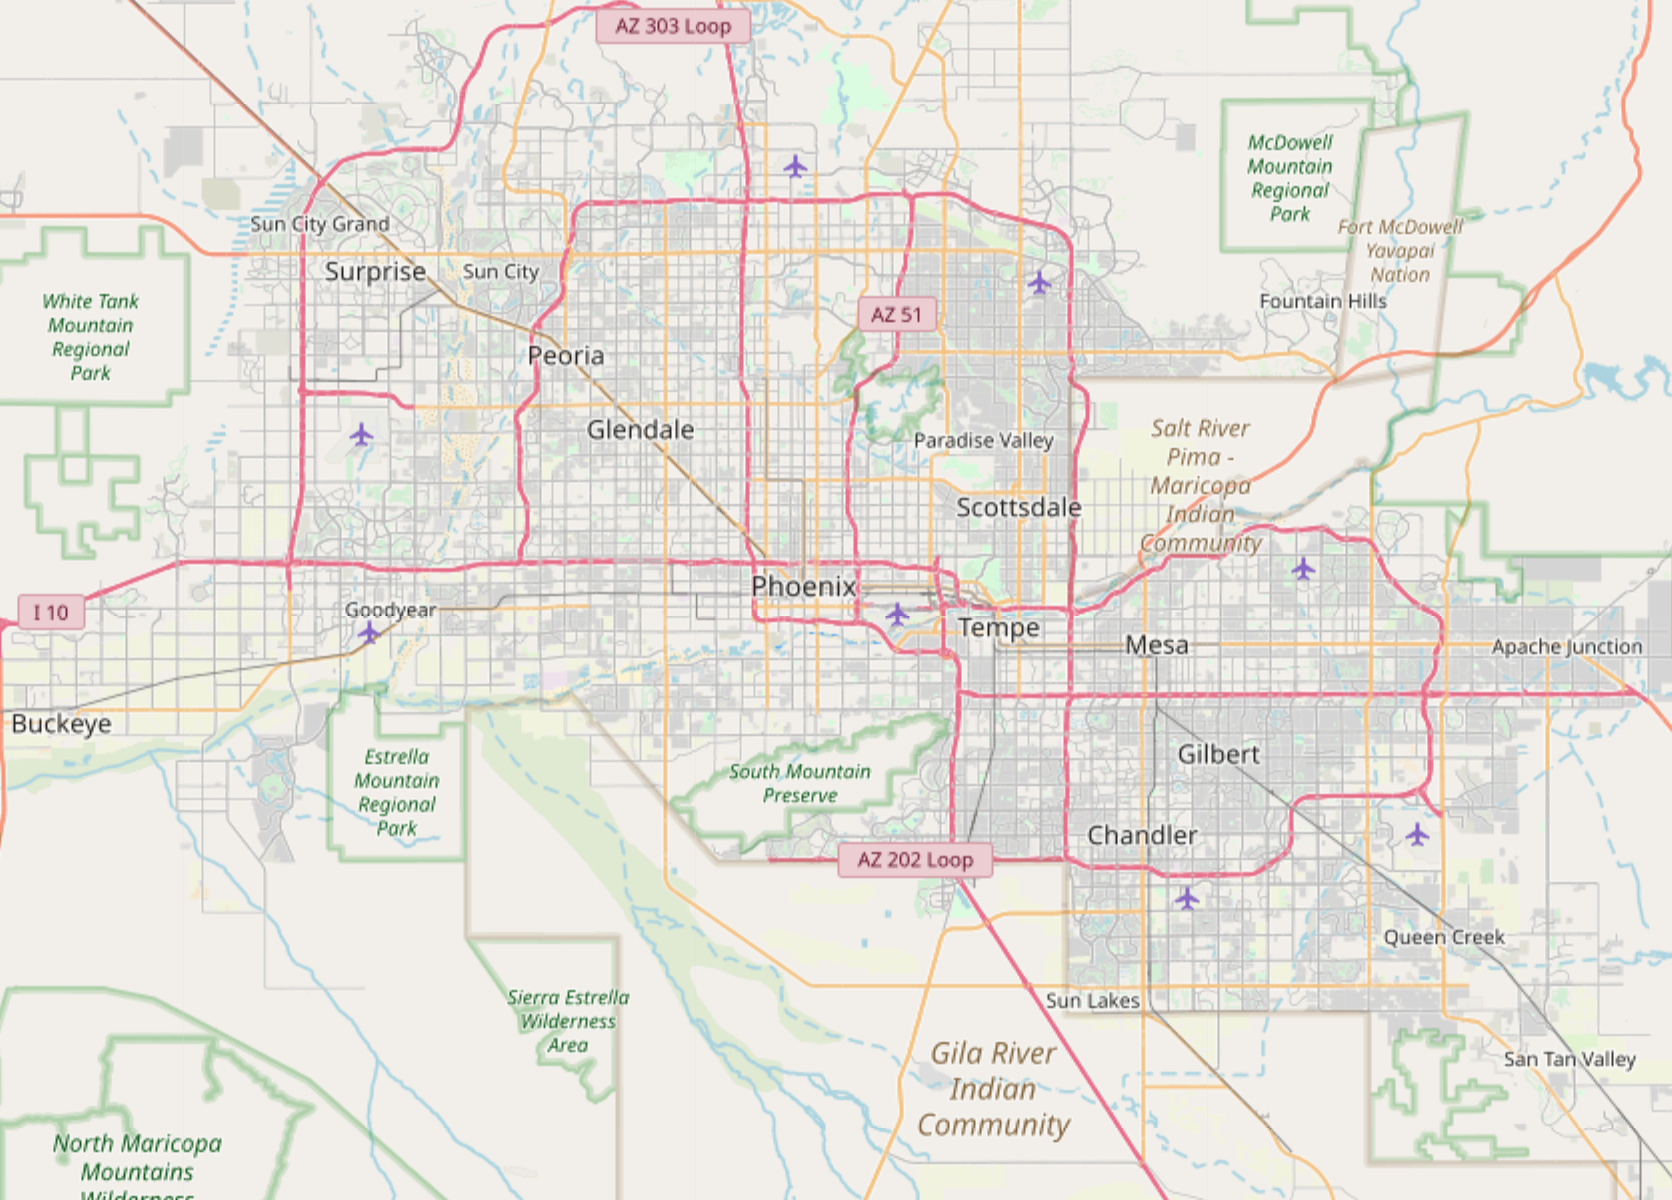
The state of Arizona has 6 active routes running through the state, comprising a total of 1,168.64 miles of roadway. These active interstates include:
- I-8
- I-10
- I-11
- I-15
- I-17
- I-19
- I-40
As you can see from the map above, Interstate 10 is a major highway that runs east and west through Phoenix, Arizona.
According to TollGuru, currently, no toll roads exist in Arizona.
However, you can use Arizona Gas Calculator to calculate gas expenses for your trips in Arizona. If you travel to nearby California, Texas, Colorado, or Oklahoma, you can use the toll calculator to calculate tolls and gas expenses for cars, trucks, trailers, buses, RVs, and motorcycles.
Popular Road Trips/Sites
Whether you’re on vacation or you’re a year-round resident in Phoenix, we’ve got a list of things to do and places to see in the city.
The following information is brought to you by Trip Advisor.
- Visit the Grand Canyon: Experience the amazing Grand Canyon National Park and the Red Rocks of Sedona on this one-day tour from Phoenix. Stop for pictures of Sedona and its Red Rock beauty on your way to the magnificent Grand Canyon.
- Old Town Scottsdale Exploration Tour: Enjoy the beautiful scenery and learn about some of the history, art, and culture of our gorgeous city. Our guide will teach you how to ride a Segway in a large, controlled area, and then you’ll glide through the Old Town and Downtown area.
- Bitter & Twisted Cocktail Parlour: Tucked into a corner space inside the city’s first-ever high-rise, the new Bitter & Twisted Cocktail Parlour (1 W. Jefferson St.) is set to help make downtown Phoenix the epicenter of the Valley’s dining and drinking scene.
- Brass Armadillo Antique Mall: The Brass Armadillo Antique Mall in Phoenix is home to over 600 antique dealers, the largest number of antique dealers under one roof in the entire desert valley.
- Phoenix Art Museum: Phoenix Art Museum has provided access to visual arts and educational programs in Arizona for nearly 60 years and is the largest art museum in the Southwestern United States.
Road Conditions
Check out the table below for road conditions in Phoenix, Arizona.
| Poor Share | Mediocre Share | Fair Share | Good Share | Vehicle Operating Costs |
|---|---|---|---|---|
| 23% | 29% | 20% | 27% | $550 |
The Arizona Department of Transportation offers the 511 Traveler Information Service. It’s simple; by just dialing 511, you can get information on closures, delays, public transit services, major airports, tourism, weather, and more.
You no longer need to remember those long phone numbers. All this information is available by dialing three digits, 511.
Does your city use speeding or red light cameras?
Phoenix currently has fixed red light cameras at 12 intersections in addition to speed-enforcement units that can be moved around school zones.
However, starting in January 2020, The city will no longer use red light and speed enforcement cameras at intersections.
Vehicles in Phoenix
In this next section, we’ll cover topics like vehicle ownership, speed traps in Phoenix, vehicle theft, the most popular vehicles driven in Phoenix, and more.
Stay tuned for more information about vehicle statistics in Phoenix.
Most Popular Vehicles Owned
According to an article by Your Mechanic, the most unusually popular car drive in Phoenix is a Nissan 350Z.
According to officialdata.org, the National Highway Traffic Safety Administration (NHTSA) has conducted one recall, zero investigations of reports of a defective product, and recorded 22 safety complaints filed against this vehicle.
Nissan has manufactured models of 350z for six years. They average 19.6 combined miles per gallon, with the latest 2008 350z above average at 20 combined MPG.
Government regulators estimate the fuel cost of the 2008 350z to be $2,500 per year. This estimate is based on 15,000 miles driven, 55 percent city driving and 45 percent highway driving, and premium gasoline.
How Many Cars Per Household
According to Data USA, the average number of cars owned per household in Phoenix, Arizona, is two.
While the largest share of households in Phoenix has two cars, the next largest share of households owns one car.
Households Without a Car
While many households in Phoenix own at least two vehicles, some households do not own a vehicle at all.
Check out this table below, showing statistics on households in Phoenix without a car.
| 2015 Households Without Vehicles | 2016 Households Without Vehicles | 2015 Vehicles Per Household | 2016 Vehicles Per Household |
|---|---|---|---|
| 9.10% | 8.40% | 1.66 | 1.71 |
According to this table above, the number of households without a car decreased from 9.1 percent in 2015 to 8.4 percent in 2016.
Free Auto Insurance Comparison
Enter your ZIP code below to compare auto insurance rates.
![]() Secured with SHA-256 Encryption
Secured with SHA-256 Encryption
Speed Traps in Phoenix
Have you ever been driving along down the road, minding your own business and following the speed of traffic when suddenly you see the flashing red and blue lights behind you?
Out of nowhere, a law enforcement officer comes from the inside of a wooded area, and you know what’s happening next; you’re getting a speeding ticket.
That’s right: if you’ve ever been in a situation like this one, you’ve been a victim of a speed trap.
All of this considered, the city of Phoenix did not make it onto the 10 Worst Arizona Speed Trap Cities, according to an article by Speedtrap.org.
Even if your city isn’t known for its speed traps, you should always follow the speed limit sign that is posted instead of the flow of traffic.
Vehicle Theft in Phoenix
Can you guess how many reported vehicle theft incidents there were in Phoenix in 2018? The FBI reported 7,815 vehicle thefts in Phoenix in 2018.
With so many vehicle thefts, how safe does that leave the city of Phoenix?
According to Neighborhood Scout, the top 10 safest neighborhoods in Phoenix are listed below.
- Near W Pecos Rd
- N 7th St / E Irvine Rd
- N Central Ave / W Carefree Hwy
- N Tatum Blvd / E Dynamite Blvd
- W Anthem Way / W Anthem Club Dr
- N 64th Ave / W Happy Valley Rd
- E Mountain Sky Ave / S 8th St
- N 56th St / E Lone Mountain Rd
- N 51st Ave / N 55th Ave
- S Desert Foothills Pky / E Frye Rd
Neighborhood Scout also revealed that your chances of becoming a victim of violent crime are approximately 7.69 per 1,000 residents. This is higher than the statewide figure, which puts residents at a 5.08 per 1,000 chance of being a victim of violent crime.
Phoenix is only safer than 7 percent of cities across the country. The city ranks seventh in Neighborhood Scout’s crime index, with 100 being the absolute safest.
The table below illustrates the incidents of violent crime in Phoenix, Arizona, in 2017.
| PHOENIX VIOLENT CRIMES | MURDER | RAPE | ROBBERY | ASSAULT |
|---|---|---|---|---|
| Report Total | 157 | 1,142 | 3,293 | 7,919 |
| Rate Per 1,000 People | 0.1 | 0.7 | 2.03 | 4.87 |
This table above shows that there were 157 murders in 2017 in Phoenix, Arizona.
Here is Phoenix’s annual number of crimes for the year 2017.
| Phoenix Annual Crimes | VIOLENT | PROPERTY | TOTAL |
|---|---|---|---|
| Number of Crimes | 12,511 | 60,353 | 72,864 |
| Crime Rate (per 1,000 residents) | 7.69 | 37.12 | 44.81 |
Because crime rates are higher in Phoenix than they are in other parts of Arizona, it might be smart to move to one of the safer neighborhoods in Phoenix listed above.
Traffic
Now that we’ve checked out Phoenix road conditions, vehicle theft, and vehicle ownership, it’s time to talk about traffic.
Buckle up as we dive right into traffic statistics in Phoenix, Arizona.
Traffic Congestion in Arizona
According to Inrix, Phoenix is the 22nd-most traffic-congested city in the state of Arizona.
| WORLD RANK | NATIONAL RANK | HOURS LOST IN CONGESTION | COST OF CONGESTION (PER DRIVER) |
|---|---|---|---|
| 125 | 22 | 125 | $1,013 |
Traffic congestion costs the average driver over $1,000 in the city of Phoenix in 2018.
Transportation
Using averages, employees in Phoenix, Arizona, have a shorter commute time (24.8 minutes) than the normal U.S. worker (25.5 minutes). Additionally, 1.96 percent of the workforce in Phoenix, Arizona, have “super commutes” in excess of 90 minutes.
But what types of transportation are used the most in Phoenix?
In 2017, the most common method of travel for workers in Phoenix, Arizona, was to drive alone (74.1 percent), followed by those who carpooled (13.3 percent) and those who worked from home (5.67 percent).
Busiest Highways
According to an article by Streets Blog USA, the transcontinental interstate is Arizona’s longest and busiest highway, connecting Phoenix and Tucson along its 2,460-mile length.
This interstate is also one of Arizona’s most dangerous roads.
How safe are Phoenix streets and roads?
We’ve talked about crime rates, but how safe are Phoenix roads? In this section, we will discuss traffic fatality rates, how fatalities happen, and why they happen on the road.
The following information is brought to you by the National Highway Traffic Safety Administration.
To begin, let’s take a look at the total fatal crashes in Phoenix counties as of 2018.
| County | Fatalities 2014 | 2015 | 2016 | 2017 | 2018 | Fatalities Per 100,000 Population 2014 | 2015 | 2016 | 2017 | 2018 |
|---|---|---|---|---|---|---|---|---|---|---|
| Maricopa | 367 | 405 | 478 | 462 | 490 | 8.96 | 9.7 | 11.22 | 10.67 | 11.11 |
| Pinal | 45 | 55 | 62 | 71 | 71 | 11.37 | 13.54 | 14.86 | 16.43 | 15.88 |
According to the table above, there were 561 traffic fatalities in Phoenix, Arizona, in 2018.
Next, let’s take a look at fatalities in crashes involving an alcohol-impaired driver.
| County | Fatalities 2014 | 2015 | 2016 | 2017 | 2018 | Fatalities Per 100,000 Population 2014 | 2015 | 2016 | 2017 | 2018 |
|---|---|---|---|---|---|---|---|---|---|---|
| Maricopa | 77 | 115 | 131 | 121 | 139 | 1.88 | 2.75 | 3.08 | 2.79 | 3.15 |
| Pinal | 18 | 18 | 16 | 11 | 23 | 4.55 | 4.43 | 3.83 | 2.55 | 5.14 |
There were 162 fatal crashes in 2018 that resulted from an alcohol-impaired driver.
This next table shows rates for single-vehicle fatalities in Phoenix.
| County | Fatalities 2014 | 2015 | 2016 | 2017 | 2018 | Fatalities Per 100,000 Population 2014 | 2015 | 2016 | 2017 | 2018 |
|---|---|---|---|---|---|---|---|---|---|---|
| Maricopa | 206 | 200 | 258 | 239 | 289 | 5.03 | 4.79 | 6.06 | 5.52 | 6.55 |
| Pinal | 20 | 33 | 39 | 31 | 29 | 5.05 | 8.13 | 9.34 | 7.17 | 6.49 |
The county of Maricopa had 260 more single-vehicle traffic fatalities than Pinal County did in 2018.
Let’s take a look at how speeding influenced the fatality rates in Phoenix.
| County | Fatalities 2014 | 2015 | 2016 | 2017 | 2018 | Fatalities Per 100,000 Population 2014 | 2015 | 2016 | 2017 | 2018 |
|---|---|---|---|---|---|---|---|---|---|---|
| Maricopa | 111 | 132 | 148 | 138 | 131 | 2.71 | 3.16 | 3.48 | 3.19 | 2.97 |
| Pinal | 17 | 16 | 24 | 21 | 15 | 4.29 | 3.94 | 5.75 | 4.86 | 3.35 |
Maricopa County had 117 speeding-related traffic fatalities than Pinal County did in 2018.
This next table below reveals fatal crashes involving roadway departures.
| County | Fatalities 2014 | 2015 | 2016 | 2017 | 2018 | Fatalities Per 100,000 Population 2014 | 2015 | 2016 | 2017 | 2018 |
|---|---|---|---|---|---|---|---|---|---|---|
| Maricopa | 98 | 122 | 136 | 122 | 156 | 2.39 | 2.92 | 3.19 | 2.82 | 3.54 |
| Pinal | 21 | 25 | 33 | 29 | 34 | 5.3 | 6.16 | 7.91 | 6.71 | 7.6 |
As you can see, there were 776 fatal crashes in Phoenix involving a roadway departure from 2014-2018.
The table below shows fatal crashes involving an intersection.
| County | Fatalities 2014 | 2015 | 2016 | 2017 | 2018 | Fatalities Per 100,000 Population 2014 | 2015 | 2016 | 2017 | 2018 |
|---|---|---|---|---|---|---|---|---|---|---|
| Maricopa | 141 | 163 | 180 | 172 | 168 | 3.44 | 3.9 | 4.23 | 3.97 | 3.81 |
| Pinal | 11 | 11 | 14 | 23 | 12 | 2.78 | 2.71 | 3.35 | 5.32 | 2.68 |
Based on our other fatality rates listed above, it is not surprising that there were only 12 fatal crashes involving an intersection in Pinal County.
This next section will show traffic fatalities involving passengers, pedestrians, and pedal cyclists.
First, let’s look at fatality rates involving a passenger occupant.
| County | Fatalities 2014 | 2015 | 2016 | 2017 | 2018 | Fatalities Per 100,000 Population 2014 | 2015 | 2016 | 2017 | 2018 |
|---|---|---|---|---|---|---|---|---|---|---|
| Maricopa | 103 | 126 | 121 | 120 | 140 | 2.51 | 3.02 | 2.84 | 2.77 | 3.17 |
| Pinal | 14 | 9 | 25 | 18 | 21 | 3.54 | 2.22 | 5.99 | 4.17 | 4.7 |
There were 161 fatalities resulting in passenger occupant traffic accidents in 2018.
The following table shows pedestrian fatalities in Phoenix.
| County | Fatalities 2014 | 2015 | 2016 | 2017 | 2018 | Fatalities Per 100,000 Population 2014 | 2015 | 2016 | 2017 | 2018 |
|---|---|---|---|---|---|---|---|---|---|---|
| Maricopa | 91 | 97 | 131 | 138 | 160 | 2.22 | 2.32 | 3.08 | 3.19 | 3.63 |
| Pinal | 4 | 9 | 6 | 11 | 4 | 1.01 | 2.22 | 1.44 | 2.55 | 0.89 |
There were only four fatal accidents involving pedestrians in Pinal County in 2018.
This last table shows pedalcyclists fatality rates in Phoenix counties.
| County | Fatalities 2014 | 2015 | 2016 | 2017 | 2018 | Fatalities Per 100,000 Population 2014 | 2015 | 2016 | 2017 | 2018 |
|---|---|---|---|---|---|---|---|---|---|---|
| Maricopa | 18 | 14 | 22 | 22 | 10 | 0.44 | 0.34 | 0.52 | 0.51 | 0.23 |
| Pinal | 0 | 4 | 2 | 3 | 1 | 0 | 0.99 | 0.48 | 0.69 | 0.22 |
There were a total of 11 pedalcyclist fatalities in 2018 in Phoenix.
Check out the table below, indicating the NHTSA’s data regarding highways in the state of Arizona with the most fatal crashes.
| Arizona Road Type | Rural | Urban | Freeway + Expressway | Other | Minor Arterial | Collector Arterial | Local | Unknown | Total Fatal Crashes |
|---|---|---|---|---|---|---|---|---|---|
| Fatal Crashes | 72 | 60 | 45 | 320 | 186 | 128 | 104 | 4 | 919 |
As you can see from the table above, most fatal crashes occur on minor arterial roads. An arterial road is just a high-capacity urban road. Depending on how much traffic is filtering through a specific area, the road could be categorized as a highway or a minor arterial road.
Besides roadway accidents, let’s also take a look at railroad crashes as they contribute to road dangers in Phoenix, Arizona.
The U.S. Department of Transportation accumulated data indicating the fatalities and injuries in Phoenix due to highway and railroad crashes in recent years, as listed in the table below.
| Calendar Year | County | Highway | Highway User Type | Rail Equipment Type | Non Suicide Fatality | Non Suicide Injury | City | State Name | Latitude | Longitude | GeoLocation |
|---|---|---|---|---|---|---|---|---|---|---|---|
| 2012 | MARICOPA | 27TH AVENUE | Truck-trailer | Yard/Switch | 0 | 0 | PHOENIX | Arizona | 33.4801533 | -112.11716 | Arizona (33.4801533, -112.1171600) |
| 2012 | MARICOPA | 27TH AVENUE | Automobile | Yard/Switch | 0 | 1 | PHOENIX | Arizona | 33.4801533 | -112.11716 | Arizona (33.4801533, -112.1171600) |
| 2012 | MARICOPA | 27TH AVENUE | Automobile | Freight Train | 0 | 0 | PHOENIX | Arizona | 33.4801533 | -112.11716 | Arizona (33.4801533, -112.1171600) |
| 2013 | MARICOPA | THOMAS RD | Automobile | Freight Train | 0 | 0 | PHOENIX | Arizona | 33.4805533 | -112.1176185 | Arizona (33.4805533, -112.1176185) |
| 2013 | MARICOPA | THOMAS RD | Pick-up truck | Light Loco(s) | 0 | 0 | PHOENIX | Arizona | 33.4805533 | -112.1176185 | Arizona (33.4805533, -112.1176185) |
| 2013 | MARICOPA | 20TH AVENUE | Automobile | Yard/Switch | 0 | 0 | PHOENIX | Arizona | 33.422646 | -112.102007 | Arizona (33.42264600, -112.10200700) |
| 2013 | MARICOPA | THOMAS RD | Automobile | Light Loco(s) | 0 | 0 | PHOENIX | Arizona | 33.4805533 | -112.1176185 | Arizona (33.4805533, -112.1176185) |
| 2013 | MARICOPA | THOMAS RD | Automobile | Yard/Switch | 0 | 0 | PHOENIX | Arizona | 33.4805533 | -112.1176185 | Arizona (33.4805533, -112.1176185) |
| 2014 | MARICOPA | OSBORN RD | Pedestrian | Freight Train | 0 | 1 | PHOENIX | Arizona | 33.4876333 | -112.1258667 | Arizona (33.4876333, -112.1258667) |
| 2014 | MARICOPA | 35TH AVENUE | Automobile | Freight Train | 0 | 0 | PHOENIX | Arizona | 33.4944833 | -112.134 | Arizona (33.4944833, -112.1340000) |
| 2014 | MARICOPA | 37TH AVENUE | Automobile | Light Loco(s) | 0 | 2 | PHOENIX | Arizona | 33.4944833 | -112.134 | Arizona (33.4944833, -112.1340000) |
| 2014 | MARICOPA | 27TH AVENUE | Automobile | Light Loco(s) | 0 | 0 | PHOENIX | Arizona | 33.4801533 | -112.11716 | Arizona (33.4801533, -112.1171600) |
| 2014 | MARICOPA | 43RD AVE | Automobile | Yard/Switch | 0 | 0 | PHOENIX | Arizona | 33.5066083 | -112.151625 | Arizona (33.5066083, -112.1516250) |
| 2014 | MARICOPA | THOMAS RD | Automobile | Light Loco(s) | 0 | 0 | PHOENIX | Arizona | 33.4805533 | -112.1176185 | Arizona (33.4805533, -112.1176185) |
| 2015 | MARICOPA | 35TH AVENUE | Automobile | Freight Train | 0 | 0 | PHOENIX | Arizona | 33.4944833 | -112.134 | Arizona (33.4944833, -112.1340000) |
| 2015 | MARICOPA | THOMAS RD | Pedestrian | Light Loco(s) | 0 | 1 | PHOENIX | Arizona | 33.4805533 | -112.1176185 | Arizona (33.4805533, -112.1176185) |
| 2015 | MARICOPA | 27TH AVENUE | Automobile | Freight Train | 0 | 0 | PHOENIX | Arizona | 33.4801533 | -112.11716 | Arizona (33.4801533, -112.1171600) |
| 2015 | MARICOPA | INDIAN SCHOOL ROAD | Automobile | Yard/Switch | 0 | 0 | PHOENIX | Arizona | 33.4949233 | -112.1352067 | Arizona (33.4949233, -112.1352067) |
| 2015 | MARICOPA | LOWER BUCKEYE RD | Automobile | Freight Train | 0 | 0 | PHOENIX | Arizona | 33.4221967 | -112.1010367 | Arizona (33.4221967, -112.1010367) |
| 2015 | MARICOPA | 27TH AVENUE | Automobile | Light Loco(s) | 0 | 0 | PHOENIX | Arizona | 33.4801533 | -112.11716 | Arizona (33.4801533, -112.1171600) |
| 2015 | MARICOPA | VANBUREN STREET | Automobile | Yard/Switch | 0 | 0 | PHOENIX | Arizona | 33.451276 | -112.164583 | Arizona (33.4512760, -112.1645830) |
| 2015 | MARICOPA | 27TH AVE | Truck-trailer | Yard/Switch | 0 | 0 | PHOENIX | Arizona | 33.4801533 | -112.11716 | Arizona (33.4801533, -112.1171600) |
| 2015 | MARICOPA | 35TH AVENUE | Pedestrian | Light Loco(s) | 0 | 1 | PHOENIX | Arizona | 33.4944833 | -112.134 | Arizona (33.4944833, -112.1340000) |
| 2016 | MARICOPA | INDIAN SCHOOL RD | Automobile | Light Loco(s) | 0 | 0 | PHOENIX | Arizona | 33.4949233 | -112.1352067 | Arizona (33.4949233, -112.1352067) |
| 2016 | MARICOPA | WASHINGTON ST. | Pick-up truck | Yard/Switch | 0 | 0 | PHOENIX | Arizona | 33.448115 | -112.1003292 | Arizona (33.4481150, -112.1003292) |
| 2016 | MARICOPA | 35TH AVENUE | Automobile | Freight Train | 0 | 0 | PHOENIX | Arizona | 33.4944833 | -112.134 | Arizona (33.4944833, -112.1340000) |
| 2016 | MARICOPA | 27TH AVENUE | Automobile | Light Loco(s) | 0 | 0 | PHOENIX | Arizona | 33.4801533 | -112.11716 | Arizona (33.4801533, -112.1171600) |
As you can see, most railroad fatalities happened on 37th Street in Phoenix.
Allstate America’s Best Drivers Report
Have you ever wondered how drivers in Phoenix compare to other drivers in the country?
According to data collected from Allstate’s Best Drivers in America Report, Phoenix is the 84th-safest city to drive in the country as of 2019.
In Phoenix, Arizona, the likelihood of a claim being made as compared to the national average is 19 percent. Residents of Phoenix typically have 9.3 average years between claims.
Even though Phoenix is ranked as the 84th-safest driving city in the U.S., 9.3 years between claims is a good number because it shows Phoenix drivers don’t get into accidents often.
Whether it’s to avoid an accident or a sudden slowdown in traffic, Phoenix’s hard-braking events per 1,000 miles is 27.4.
Even though this number isn’t super high, it’s always a good idea to pay attention while driving so you don’t have to hard-brake.
Ridesharing
Are you looking for ridesharing services in Phoenix, Arizona? What services are available?
According to RideGuru, these are the ridesharing services located near you.
- Blacklane: When you order a Blacklane car, a luxury vehicle with seating for one to five people will pick you up.
- Carmel: When you order a Carmel car, you have the choice of riding in a Sedan, Minivan, Stretch Limousine, SUV, and SUV super-stretch limo.
- Limos.com
- Lyft
- SuperShuttle: When you order a SuperShuttle, a shuttle or black car (depending on which service you order) will pick you up. SuperShuttle has reservation options for one to ten passengers.
- Taxi
- TotalRide: Order a ride in a typical sedan vehicle similar to Uber X.
- Uber
- Zum: When you order a Zum car for your children, a standard four-door vehicle will arrive to pick up your kids. All vehicles driven by Zum drivers must be newer than 2009, and drivers must pass a rigorous background check.
E-star Repair Shops
Are you in need of vehicle repairs? Are you looking for a repair you can trust?
You’ve come to the right place, because an Estar repair shop can help. E-star is an Esurance-sponsored program that helps drivers find the best repair shops in their area.
Check out the top 10 vehicle repair shops in Phoenix listed in the table below.
| Shop Name | Address | Contact Information |
|---|---|---|
| CARSTAR MICHAEL'S COLLISION | 11044 N CAVE CREEK RD PHOENIX AZ 85020 | email: [email protected] P: (602) 371-1700 |
| CHANEY'S COLLISION CENTERS | 7161 N 61st Ave GLENDALE AZ 85301 | email: [email protected] P: (623) 934-9000 F: (623) 939-8658 |
| CHAPMAN AUTO BODY | 999 W Bell Road PHOENIX AZ 85023 | email: [email protected] P: (602) 866-6180 |
| GERBER - AVONDALE | 775 NORTH DYSART ROAD AVONDALE AZ 85323 | email: [email protected] P: (623) 935-6133 F: (623) 925-9451 |
| GERBER - MESA/BROADWAY RD | 1015 W BROADWAY RD MESA AZ 85210 | email: [email protected] P: (480) 969-5485 F: (480) 962-8745 |
| GERBER - SCOTTSDALE/SAN VICTOR DRIVE | 8910 E SAN VICTOR DR SCOTTSDALE AZ 85258 | email: [email protected] P: (480) 391-7000 F: (480) 391-0200 |
| GERBER - TEMPE/PRIEST DR. | 8045 S PRIEST DRIVE TEMPE AZ 85284 | email: [email protected] P: (480) 422-3870 F: (480) 705-3212 |
| GERBER - TEMPE/UNIVERSITY DRIVE | 2100 W UNIVERSITY DR TEMPE AZ 85281 | email: [email protected] P: (480) 774-9999 F: (480) 774-9997 |
| Service King 75th Ave | 16000 North 75th Ave PEORIA AZ 85382 | email: [email protected] P: (623) 486-4810 F: (623) 486-3334 |
| SERVICE KING GILBERT | 1572 W. Harvard Avenue GILBERT AZ 85233 | email: [email protected] P: (480) 507-8778 F: (480) 507-8194 |
Weather
What is the weather like in Phoenix? The information in the table below is brought to you by U.S. Climate Data.
| PHOENIX, ARIZONA WEATHER | DETAILS |
|---|---|
| Annual High Temperature | 86.7 F |
| Annual Low Temperature | 63.4 F |
| Average Temperature | 75.05 F |
| Average Annual Precipitation (Rainfall) | 8.04 inches |
Speaking of weather, the frequency of national disasters can affect your car insurance rate.
The city of Phoenix has experienced 15 total natural disasters, which is slightly higher than the nationwide average of 13.
A total of 11 of natural disasters in Phoenix were declared by the president as major disasters, while one was declared to be an emergency.
The causes of these natural disasters are as follow:
- Floods: 10
- Storms: 9
- Fires: 3
- Flash Flood: 1
- Heavy Rain: 1
- Hurricane: 1
- Tornado: 1
- Wind: 1
Keep in mind that some natural disasters may fall into more than one category noted above.
What kind of car insurance do you need to protect your vehicle in the case of a natural disaster? Watch the video below to learn more about comprehensive coverage.
Comprehensive coverage will take care of you if your car is damaged in the event of a natural disaster.
This type of coverage could cost you hundreds of dollars more per year but could save you thousands of dollars in the long run.
Public Transit
We know that not everyone in Phoenix owns a car, but what type of public transit is available in Phoenix?
Valley Metro is the regional public transportation agency providing coordinated transit services to residents of metro Phoenix.
From the regional bus, light rail, and paratransit service to alternative commuter solutions, Valley Metro’s core mission is to develop and operate a network of transit services.
Here is a list of Valley Metro services:
- Local, Express, and RAPID commuter bus service
- Light rail
- Neighborhood circulators
- Rural route
- Paratransit service
- Vanpool service
- Commuter programs
If you’re wondering what fares cost for the Valley Metro Transit System, please click here.
Fares may be purchased onboard the bus, but the exact amount is required. You can purchase bus tickets at your local Safeway, Circle K, Sinclair gas station, and more.
For more information about the Phoenix transit system, please visit ValleyMetro.org.
Alternate Transportation
The city of Phoenix is allowing an electric scooter pilot program to start in March 2020.
The city is allowing up to 300 scooters for each of the three scooter companies participating in the pilot program.
- Lime: Lime’s scooters are black and green
- Bird: Bird’s scooters are black and white
- Spin: Spin’s scooters are orange and black
How do I get a scooter to start?
First, you’ll need to download an app. Each company has its own. Each app has a map that tells you where the scooters are located. Enter your credit card information and follow the instructions.
Parking in Metro Areas
Approximately 42 public and private parking structures are available throughout the Downtown vicinity of Phoenix, totaling more than 25,000 parking spaces at various times throughout the day and night. The main parking structures are located between Seventh Street and Seventh Avenue, from Fillmore to Lincoln Streets.
According to Phoenix.gov, Currently, the City of Phoenix Street Transportation Department operates approximately 2,000 parking meters in the Downtown, Uptown, Capitol, and Phoenix College areas.
All meters and pay stations are enforced 8 a.m. to 10 p.m. daily, including weekends and holidays.
Meters cost $1.50 per hour, and the coin-only meters cost $1 per hour.
Most meters accept credit/debit cards and coins, and others only accept coins.
To pay-by-phone for on-street parking meters and stations throughout the city, use the Parkmobile app.
Do you have an electric car that needs to be charged every time you park?
ChargeHub says the city of Phoenix has 382 public charging station ports (Level two and Level three) within 15km. Ninety-two percent of the ports are Level Two charging ports, and 16 percent of the ports offer free charges for your electric car.
The two main charging networks in operation are Blink and ChargePoint. You can find out more about the charging networks (policies, pricing, and registration information) by visiting the networks section.
Air Quality in Phoenix
When cars were first made, they would emit harmful toxins into the air. Today, this isn’t really quite as much of an issue as it was back then, but it’s still important to know how clean the air is in your city.
The following table indicates the air quality in the city of Phoenix based on the Environmental Protection Agency’s reports from 2017, 2018, and 2019.
| PHOENIX AIR QUALITY INDEX | 2017 | 2018 | 2019 |
|---|---|---|---|
| Days with AQI | 365 | 365 | 274 |
| Good Days | 32 | 42 | 56 |
| Days Moderate | 238 | 238 | 85 |
| Days Unhealthy for Sensitive Groups | 82 | 66 | 22 |
| Days Unhealthy | 11 | 7 | 1 |
| Days Very Unhealthy | 2 | 12 | 10 |
The data above shows that there have been more moderate days than good days and an average of eight “very unhealthy” days per year from 2017-2019.
Military/Veterans
Are you an active military member or a veteran?
If so, you could be eligible for a military car insurance discount. But before we get into all of that, let’s go over some Phoenix military statistics.
Veterans by Service Period
Phoenix, AZ, has a large population of military personnel who served in Vietnam. Approximately 22,834 men and women living in Phoenix served in the Vietnam War.
Phoenix is home to 13,713 veterans that served in the second Gulf War and 11,956 veterans having served in the first Gulf War.
Military Bases within an Hour
There are five military bases in the state of Arizona:
- Davis-Monthan AFB
- Fort Huachuca
- Luke AFB
- MCAS Yuma
- Yuma Proving Ground
Davis-Monthan AFB is located in Tucson, not far from Interstates 10 and 19. Luke AFB is in Litchfield Park, Arizona, a suburban community outside the city of Phoenix, the capital of Arizona.
Military Discounts by Provider
The following car insurance companies offer military discounts in Phoenix:
- Allstate
- Farmers
- Geico (active or retired)
- Liberty Mutual (must be active duty)
- Metlife
- Safeco (active or retired)
- State Farm (only offered in select states)
- USAA
USAA Available in State
In addition, USAA also offers discounts for military garages to hold vehicles on base.
USAA offers military car insurance for both military members and their families. See how USAA’s car insurance rates compare to other rates at other companies across the board.
| Group | Average |
|---|---|
| Allstate | $6,172.19 |
| American Family | $4,946.51 |
| Farmers | $6,609.09 |
| Geico | $2,864.68 |
| Nationwide | $4,593.72 |
| Progressive | $4,433.95 |
| State Farm | $6,279.06 |
| Travelers | $3,870.57 |
| USAA | $3,440.60 |
Unique Phoenix Laws
Before we let you go, let’s take a look at unique Phoenix laws.
Here’s the 411 on tiny home laws, hands-free laws, food truck laws, and more.
Hands-Free Laws
As of April 2019, Arizona became the 48th state to ban drivers from using handheld cellphones behind the wheel (see video above)
The law states that in a moving car, the driver is not allowed to operate a cellphone, including to write, send, or read any text-based communication. Drivers also aren’t allowed to hold or support a mobile device with any part of their body.
Food Trucks
Maricopa.gov says the Mobile Food industry has grown leaps and bounds here in Maricopa County, and the Department recognizes the vast opportunity that this industry provides to the community.
Mobile Food Type I, II, and III are approved to operate at Farmers Markets, Special Events, business locations, private functions, etc., in Maricopa County, provided they are operating within the allowances of the permit issued to them.
To apply for a mobile food truck permit Phoenix, click here.
Tiny Home
Tiny housing, sometimes referred to as micro-housing, generally refers to a house or small living space that is typically more than 300 square feet but less than 500 square feet, according to the Urban Land Institute.
For more information on tiny homes in Phoenix, please visit the Arizona Department of Revenue.
Enter your ZIP code below to compare auto insurance rates.
![]() Secured with SHA-256 Encryption
Secured with SHA-256 Encryption
Phoenix Car Insurance FAQs
Do you have any other questions about car insurance in Phoenix, Arizona?
Take a look at some of these frequently asked questions listed below.
What is the cost of living like in Phoenix?
According to a study by Sperling’s Best Places, the cost of living in Phoenix is above the nationwide average. Compared to the rest of the country, Phoenix’s cost of living is 3.7 percent higher than the U.S. average.
The median home cost in Phoenix is $239,400. Home appreciation in the last 10 years has been 8.1 percent.
What car insurance is required in Phoenix?
The required minimum amounts of liability car insurance coverage in Arizona are:
- $15,000 for bodily injury or death of one person in an accident caused by the driver of the insured vehicle
- $30,000 for total bodily injury or death liability in an accident caused by the driver of the insured vehicle, and
- $10,000 for property damage per accident caused by the driver of the insured vehicle.
This basic coverage pays the medical bills, property damage bills, and other costs of drivers, passengers, and pedestrians who are injured or have their vehicle damaged in a car accident you cause.
What do I do if I get into an accident in Phoenix?
Your liability coverage (listed above) will kick in if any family member is driving your vehicle, or if you’ve given someone else permission to use it. It will likely also cover you if you get into an accident in a rental car.
Finally, remember that the liability coverage we discussed doesn’t apply to your own injuries or vehicle damage after an Arizona car accident. You’ll need different (additional) coverage for that if you’re involved in a car accident, and no one else’s coverage applies to your losses.
What happens if I get caught driving without insurance?
If you’re asked for proof of insurance during a traffic stop or after a car accident in Arizona, and a law enforcement officer learns that you don’t have insurance, you’ll almost certainly face suspension of your vehicle’s registration and/or your driver’s license.
In order to get these privileges reinstated, you’ll need to pay fees and file proof of financial responsibility with the Arizona Motor Vehicle Department.
Of course, these penalties will likely pale in comparison to the financial hit you could take if you’re in a car accident, and you don’t have car insurance.
What languages do I need to know in Phoenix?
Data USA says the most common foreign languages spoken in Phoenix, Arizona, are Spanish (467,652 speakers), Tagalog (including Filipino) (7,570 speakers), and Chinese (including Mandarin, Cantonese) (7,179 speakers).
Now that we’ve covered all you need to know about car insurance in Phoenix, Arizona, it’s time to start shopping for your very own insurance policy. All you have to do is use our free tool by entering your zip code in the box below to begin.
Happy shopping.