The Ultimate Tennessee Car Insurance Guide (Costs + Coverage)
Free Auto Insurance Comparison
Enter your ZIP code below to compare auto insurance rates.
![]() Secured with SHA-256 Encryption
Secured with SHA-256 Encryption
Heidi Mertlich
Licensed Insurance Agent
Heidi works with top-rated insurance carriers to bring her clients the highest quality protection at the most competitive prices. She founded NoPhysicalTermLife.com, specializing in life insurance that doesn’t require a medical exam. Heidi is a regular contributor to several insurance websites, including FinanceBuzz.com, Insurist.com, and Forbes. As a parent herself, she understands the need ...
Licensed Insurance Agent
UPDATED: Feb 16, 2024
It’s all about you. We want to help you make the right coverage choices.
Advertiser Disclosure: We strive to help you make confident insurance decisions. Comparison shopping should be easy. We partner with top insurance providers. This doesn’t influence our content. Our opinions are our own.
Editorial Guidelines: We are a free online resource for anyone interested in learning more about auto insurance. Our goal is to be an objective, third-party resource for everything auto insurance related. We update our site regularly, and all content is reviewed by auto insurance experts.
| Tennessee Statistics Summary | Details |
|---|---|
| Road Miles | Total in State: 95,561 Vehicle Miles Driven: 72,336 Million |
| Vehicles | Registered: 5,330,937 Total Stolen: 12,599 |
| State Population | 6,770,010 |
| Most Popular Vehicle | Ford F150 |
| Uninsured Motorists | 20% State Rank: 5th |
| Total Driving Fatalities | 2008-2017 Speeding: 2,094 Drunk Driving: 2,726 |
| Annual Premiums by Coverage Type | Collision: $309.07 Comprehensive: $148.45 Liability: $413.91 |
| Cheapest Providers | Travelers Prop Cas Ins Co and USAA |
Loved for its rolling hills, the Great Smokey Mountains, scenic hiking, green pastures, and the Music City capital of the world, Tennessee is expected to gain at least one million people by the year 2040.
With a current population of almost seven million people and just over five million registered vehicles on the road, it’s imperative to have car insurance in Tennessee– but not just any old car insurance policy.
Tennessee is ranked fifth in the U.S. for uninsured drivers. That’s right! Over 20 percent of drivers in Tennessee break the law every day and drive without car insurance.
Searching for the right car insurance policy is hard work, especially if you have absolutely no idea what you’re doing and you haven’t the slightest clue where to start. Don’t worry. We’ve got you covered.
In this ultimate guide to Tennessee car insurance, we will cover topics like types of car insurance, rates, driving laws, safety laws, rules of the road, risks of the road and much more.
So don’t go away, because we want to start with the basics: Tennessee car insurance coverage and rates.
Tennessee Car Insurance Coverage and Rates
What’s the bottom line? How much is Tennessee car insurance actually going to cost you?
Insurance isn’t a “one size fits all” type of deal, and rates depend on a number of different factors.
Feeling overwhelmed already? We know you don’t want to pay more than you have to, but it’s important to be aware of the different levels of insurance and how you can save money on each of the individual policy.
To help you understand where we’re coming from, let’s talk a little bit about Tennessee’s car culture and then we will get into minimum coverage options.
Tennessee’s Car Culture
According to the Hartford, for the average driver in Tennessee, having a nice car – or at least a nicely painted and decked out car – offers a feeling of empowerment above and beyond the practical aspect of having your own transportation.
The love of eye-catching cars extends to the numerous car museums throughout the state. The Lane Motor Museum just outside Nashville features over 400 quirky and unique vehicles from obscure automakers.
In addition to the Lane Museum, Tennessee is home to several other institutions that celebrate the beauty of cars, from the Hollywood Star Cars Museum, where you can see the Batmobile and the Beverly Hillbillies jalopy, to the Floyd Garrett Muscle Car Museum, where you can see one of the largest collections of American-made cars in the nation.
Tennessee Minimum Coverage
The information below is brought to you by NOLO.
What is minimum car insurance coverage and why is it important to carry? Minimum car insurance is also known as liability car insurance coverage. By state law, it is the least amount of car insurance a person can carry.
Tennessee minimum liability car insurance requirements are as follows:
- $25,000 liability coverage for bodily injury or death of one person in an accident caused by the owner/driver of the insured vehicle
- $50,000 liability coverage for total bodily injury or death liability in an accident caused by the owner/driver of the insured vehicle
- $15,000 liability coverage for property damage per accident caused by the owner/driver of the insured vehicle
Tennessee is an at-fault state; this means that the person who was at fault for causing the car accident is also responsible for any resulting harm (from a practical standpoint, the at-fault driver’s insurance carrier will absorb these losses, up to policy limits).
Liability coverage pays the medical bills, property damage bills, and other costs of drivers, passengers, and pedestrians who are injured or have their vehicle damaged in a car accident you cause, up to coverage limits.
Read more: Auto Insurance Basics: Property Damage Liability
Vehicle repairs and medical bills can add up very quickly, and if you don’t have enough car insurance coverage, you will end up paying for these bills out of your own pocket.
Interested in finding out how to bulk up your existing car insurance policy so you don’t get stuck paying for more bills than you have to? Keep reading for more info below.
Forms of Financial Responsibility
What is a form of financial responsibility?
A form of financial responsibility is just proof of insurance. An insurance card proves that a driver is financially responsible if and when he or she is involved and/or causes an accident.
Acceptable forms of proof of insurance are:
- Valid liability insurance ID cards
- Copy of your current car’s insurance policy
- Valid insurance binder (a temporary form of car insurance)
- Electronic insurance card (or picture proof of insurance card)
According to the Tennessee Department of Revenue, you can show proof of financial responsibility to satisfy your legal requirement under Tennessee law by:
- posting a bond with the Department of Revenue for $65,000
- making a cash deposit with the Department of Revenue for $65,000
If you are pulled over and cannot provide proof of insurance, you may have to pay a fine of up to $300.
Driving without car insurance in Tennessee is considered a Class A misdemeanor — with punishments up to 11 months, 29 days in jail and/or up to $2,500 in fines — for knowingly providing false proof of insurance.
Tennessee’s Premiums as a Percentage of Income
No matter where you live in the U.S., your annual per capita income is the amount of money you take home after you pay your taxes.
Your car insurance premium is the yearly amount of money you pay for your car insurance policy.
In 2014, Tennessee had an average annual per capita income of $36,909. Tennessee residents paid an average of $855.56 for full car insurance coverage the same year.
Tennesseans pay an average of 2.32 percent of their annual disposable income on car insurance.
If you break down this rate at a monthly cost, Tennessee drivers pay $71.29 per month for car insurance. Keep in mind this is an average rate for full coverage, so if you have a smaller policy, your rate could be much lower.
Countrywide, Americans pay an average of $981.77 per year on full coverage car insurance and have an average salary of $40,859.
If we look at the surrounding states’ premiums, Kentucky insurance is slightly higher at $917.49 per year; Alabama’s average is slightly lower at $837.09 per year and Georgians pay a higher rate at $991.25 for full coverage.
CalculatorPro
Tennessee Core Coverage
| Coverage Type | Annual Costs (2015) |
|---|---|
| Liability | $413.91 |
| Collision | $309.07 |
| Comprehensive | $148.45 |
| Combined | $871.43 |
The data from the table above is pulled directly from a very reputable source – the National Association of Insurance Commissioners. Because this data is from 2015, you can expect rates to be higher from now on.
Americans pay an average of $981.77 per year for car insurance. Tennesseans usually pay around $855.56 for a full coverage insurance policy.
While having minimum liability insurance is very important and within state regulation, you might want to consider getting a full coverage car insurance policy. Afterall – the more car insurance, the better.
Tennessee’s Additional Liability Coverage
| Loss Ratio | 2014 | 2013 | 2012 |
|---|---|---|---|
| Medical Payments | 69.12% | 71.17% | 75.43% |
| Uninsured/Underinsured Motorist Coverage | 68.06% | 68.13% | 67.06% |
Medpay, uninsured and underinsured motorist coverage are optional liability add-ons that any driver can tack on to his or her already existing car insurance policy.
But why should you consider adding these extra coverage options in the first place?
Twenty percent of Tennessee drivers break the law every single day and drive without car insurance. Tennessee is ranked 5th in the U.S. for uninsured drivers.
Let’s say you are hit by a driver who is uninsured. This driver might have thousands of dollars in the bank to cover the costs of damages to your vehicle, but chances are, he is broke and will likely go bankrupt trying to pay for damages to his own vehicle and yours.
You’ll never see a dime of the money that was rightfully owed to you.
In cases similar to these, uninsured car insurance coverage is a dream to have. Even if you’re hit by an uninsured driver, you never have to worry. Remember, one in five drivers are uninsured.
What is a loss ratio percentage and what does it have to do with a car insurance company?
As you can see in the chart above, we mention loss ratio percentages.
Loss ratio percentages are a way we can measure a company’s financial strength. They tell exactly how many filed claims were actually paid out by the insurance company.
If a company has a loss ratio percentage that is too low (under 50 percent), the company might be scamming its clients because they aren’t paying enough claims.
On the other hand, if the company’s loss ratio percentage is too high (over 100 percent), the company could be at risk of going bankrupt.
According to the table above, all of the loss ratio percentages are normal. They stay well within the range of 50-100 percent.
When you’re looking for a new insurance provider, make sure you ask them, “What is your loss ratio percentage?”
Add-ons, Endorsements, and Riders
Looking for even more car insurance coverage? Like we said before, car insurance should be specifically tailored to fit your lifestyle.
Click on the links below to learn more about each type of coverage listed.
- Guaranteed Auto Protection (GAP)
- Personal Umbrella Policy (PUP)
- Rental Reimbursement
- Emergency Roadside Assistance
- Mechanical Breakdown Insurance
- Non-Owner Car Insurance
- Modified Car Insurance Coverage
- Classic Car Insurance
- Pay-As-You-Drive or Usage-Based Insurance
Add one or add them all; the choice is up to you.
Male vs. Female Rates in Tennessee
Did you know factors like gender, marital status and age can affect your car insurance rate?
| Company | Married 35-year old female | Married 35-year old male | Married 60-year old female | Married 60-year old male | Single 17-year old female | Single 17-year old male | Single 25-year old female | Single 25-year old male |
|---|---|---|---|---|---|---|---|---|
| Allstate P&C | $2,796.09 | $2,684.61 | $2,516.49 | $2,612.46 | $10,516.65 | $11,441.86 | $2,980.14 | $3,082.46 |
| Mid-Century Ins Co | $1,817.48 | $1,850.03 | $1,631.91 | $1,788.38 | $7,410.65 | $7,883.17 | $2,457.63 | $2,601.27 |
| Geico General | $2,182.11 | $2,202.22 | $2,010.58 | $2,010.58 | $6,620.63 | $6,739.05 | $2,216.18 | $2,286.01 |
| SAFECO Ins Co of IL | $3,639.40 | $129.00 | $2,991.77 | $3,342.39 | $14,916.05 | $16,572.79 | $3,902.85 | $4,159.27 |
| Nationwide Mutual | $2,192.98 | $2,211.90 | $1,964.40 | $1,997.15 | $6,012.22 | $7,760.40 | $2,520.95 | $2,739.66 |
| Progressive Hawaii | $1,864.12 | $1,757.10 | $1,519.40 | $1,588.93 | $8,386.68 | $9,440.45 | $2,246.65 | $2,451.94 |
| State Farm Mutual Auto | $1,612.16 | $1,612.16 | $1,452.60 | $1,452.60 | $4,907.17 | $6,139.77 | $1,821.23 | $2,116.70 |
| Travelers Prop Cas Ins Co | $1,767.42 | $1,860.42 | $1,606.70 | $1,710.20 | $4,956.52 | $6,143.14 | $1,882.49 | $1,981.27 |
| USAA | $1,548.81 | $1,577.29 | $1,397.27 | $1,398.41 | $5,501.37 | $6,309.85 | $2,023.45 | $2,157.82 |
As you can see, men usually pay more for car insurance than women do.
As far as rates based on age, car insurance companies know young drivers haven’t had much experience on the road and are more likely to get into a car accident or drive over the speed limit – this is exactly why you might pay more for car insurance as a teenager than you would as a 30-year-old.
If you keep a clean record as a teenage driver, your rates should significantly decrease by the time you turn 25.
Cheapest Rates by Zip Code in Tennessee
Where you live has a lot to do with car insurance rate as well.
Find your zip code in the tables below.
| Cheapest ZIP Codes in Tennessee | City | Average by ZIP Codes | Most Expensive Company | Most Expensive Rate | 2nd Most Expensive Company | 2nd Most Expensive Rate | Cheapest Company | Cheapest Rate | 2nd Cheapest Company | 2nd Cheapest Rate |
|---|---|---|---|---|---|---|---|---|---|---|
| 37601 | JOHNSON CITY | $3,173.65 | Liberty Mutual | $5,266.60 | Allstate | $4,163.63 | State Farm | $2,311.58 | Travelers | $2,392.43 |
| 37614 | JOHNSON CITY | $3,175.79 | Liberty Mutual | $5,266.60 | Allstate | $4,164.94 | State Farm | $2,383.48 | Travelers | $2,424.67 |
| 37620 | BRISTOL | $3,176.81 | Liberty Mutual | $5,174.63 | Allstate | $4,087.45 | State Farm | $2,160.43 | USAA | $2,449.19 |
| 37692 | UNICOI | $3,177.19 | Liberty Mutual | $5,368.79 | Allstate | $4,162.22 | State Farm | $2,283.56 | Travelers | $2,387.75 |
| 37604 | JOHNSON CITY | $3,187.79 | Liberty Mutual | $5,266.60 | Allstate | $4,164.94 | State Farm | $2,311.47 | Travelers | $2,431.30 |
| 37684 | MOUNTAIN HOME | $3,188.99 | Liberty Mutual | $5,266.60 | Allstate | $4,189.90 | State Farm | $2,315.51 | Travelers | $2,431.22 |
| 37690 | TELFORD | $3,197.59 | Liberty Mutual | $5,266.60 | Allstate | $4,115.87 | State Farm | $2,177.69 | Travelers | $2,422.75 |
| 37615 | JOHNSON CITY | $3,199.74 | Liberty Mutual | $5,266.60 | Allstate | $4,171.03 | State Farm | $2,267.57 | Travelers | $2,452.07 |
| 37643 | ELIZABETHTON | $3,200.59 | Liberty Mutual | $5,321.14 | Allstate | $4,163.43 | State Farm | $2,273.92 | Travelers | $2,423.68 |
| 37694 | WATAUGA | $3,210.85 | Liberty Mutual | $5,321.14 | Allstate | $4,188.17 | State Farm | $2,271.87 | Travelers | $2,387.21 |
| 37650 | ERWIN | $3,212.85 | Liberty Mutual | $5,368.79 | Allstate | $4,134.59 | State Farm | $2,335.93 | Travelers | $2,361.87 |
| 37659 | JONESBOROUGH | $3,217.01 | Liberty Mutual | $5,266.60 | Allstate | $4,164.05 | State Farm | $2,285.69 | Travelers | $2,451.10 |
| 37663 | KINGSPORT | $3,220.96 | Liberty Mutual | $4,961.30 | Allstate | $4,187.37 | State Farm | $2,360.95 | USAA | $2,435.57 |
| 37657 | FLAG POND | $3,222.95 | Liberty Mutual | $5,368.79 | Allstate | $4,134.60 | State Farm | $2,345.30 | Travelers | $2,441.62 |
| 37617 | BLOUNTVILLE | $3,226.34 | Liberty Mutual | $4,961.30 | Allstate | $4,185.82 | USAA | $2,435.57 | State Farm | $2,439.98 |
| 37686 | PINEY FLATS | $3,248.25 | Liberty Mutual | $5,321.14 | Allstate | $4,179.29 | State Farm | $2,377.89 | USAA | $2,435.57 |
| 37682 | MILLIGAN COLLEGE | $3,257.44 | Liberty Mutual | $5,266.60 | Allstate | $4,767.24 | State Farm | $2,315.51 | Travelers | $2,463.58 |
| 37618 | BLUFF CITY | $3,259.15 | Liberty Mutual | $5,321.14 | Allstate | $4,183.25 | State Farm | $2,299.18 | USAA | $2,449.19 |
| 37660 | KINGSPORT | $3,265.10 | Liberty Mutual | $5,141.66 | Allstate | $4,156.94 | State Farm | $2,403.39 | USAA | $2,435.31 |
| 37680 | LAUREL BLOOMERY | $3,266.48 | Liberty Mutual | $6,063.27 | Allstate | $4,182.23 | State Farm | $2,315.51 | Travelers | $2,368.74 |
| 37688 | SHADY VALLEY | $3,269.32 | Liberty Mutual | $6,063.27 | Allstate | $4,189.80 | State Farm | $2,306.69 | Travelers | $2,395.59 |
| 37656 | FALL BRANCH | $3,275.84 | Liberty Mutual | $5,141.66 | Allstate | $4,774.39 | State Farm | $2,181.50 | Travelers | $2,579.06 |
| 37665 | KINGSPORT | $3,282.60 | Liberty Mutual | $5,141.66 | Allstate | $4,209.03 | USAA | $2,435.31 | State Farm | $2,476.80 |
| 37664 | KINGSPORT | $3,286.44 | Liberty Mutual | $5,445.99 | Allstate | $4,093.61 | State Farm | $2,416.48 | USAA | $2,435.25 |
| 37658 | HAMPTON | $3,294.15 | Liberty Mutual | $6,049.58 | Allstate | $4,171.16 | State Farm | $2,296.29 | Travelers | $2,374.93 |
Memphis is the second-largest city in Tennessee, so it makes sense that car insurance might cost the most here.
| Most Expensive ZIP Codes in Tennessee | City | Average by ZIP Code | Most Expensive Company | Most Expensive Rate | 2nd Most Expensive Company | 2nd Most Expensive Rate | Cheapest Company | Cheapest Rate | 2nd Cheapest Company | 2nd Cheapest Rate |
|---|---|---|---|---|---|---|---|---|---|---|
| 38118 | MEMPHIS | $4,991.62 | Liberty Mutual | $7,567.94 | Allstate | $6,771.40 | USAA | $3,428.10 | Travelers | $3,691.39 |
| 38112 | MEMPHIS | $4,984.01 | Liberty Mutual | $8,412.97 | Allstate | $6,445.39 | USAA | $3,294.44 | State Farm | $3,560.64 |
| 38128 | MEMPHIS | $4,967.47 | Liberty Mutual | $8,114.32 | Allstate | $6,409.64 | USAA | $3,252.80 | Travelers | $3,698.03 |
| 38132 | MEMPHIS | $4,958.99 | Liberty Mutual | $7,567.94 | Allstate | $6,771.32 | USAA | $3,428.10 | Travelers | $3,642.02 |
| 38116 | MEMPHIS | $4,954.44 | Liberty Mutual | $8,294.54 | Allstate | $6,771.39 | USAA | $3,428.10 | Travelers | $3,656.30 |
| 38131 | MEMPHIS | $4,952.11 | Liberty Mutual | $8,294.54 | Allstate | $6,771.01 | USAA | $3,428.10 | State Farm | $3,644.58 |
| 38126 | MEMPHIS | $4,950.53 | Liberty Mutual | $8,470.60 | Allstate | $6,771.39 | USAA | $3,323.82 | State Farm | $3,408.64 |
| 38111 | MEMPHIS | $4,919.47 | Liberty Mutual | $7,958.43 | Allstate | $6,334.58 | USAA | $3,332.11 | Travelers | $3,698.03 |
| 38127 | MEMPHIS | $4,916.69 | Liberty Mutual | $7,432.01 | Allstate | $6,482.95 | USAA | $3,351.71 | State Farm | $3,640.48 |
| 38122 | MEMPHIS | $4,912.60 | Liberty Mutual | $7,958.43 | Allstate | $6,289.78 | USAA | $3,294.44 | Travelers | $3,691.39 |
| 38107 | MEMPHIS | $4,906.85 | Liberty Mutual | $8,412.97 | Allstate | $6,631.77 | USAA | $3,351.71 | State Farm | $3,360.10 |
| 38115 | MEMPHIS | $4,904.13 | Liberty Mutual | $7,771.74 | Farmers | $5,987.91 | USAA | $3,012.48 | Travelers | $3,728.53 |
| 38105 | MEMPHIS | $4,889.05 | Liberty Mutual | $8,412.97 | Allstate | $6,771.31 | State Farm | $3,329.34 | USAA | $3,346.64 |
| 38108 | MEMPHIS | $4,886.59 | Liberty Mutual | $8,412.97 | Allstate | $6,204.92 | USAA | $3,351.71 | State Farm | $3,563.36 |
| 38114 | MEMPHIS | $4,883.14 | Liberty Mutual | $7,811.89 | Allstate | $6,771.32 | USAA | $3,323.82 | State Farm | $3,494.64 |
| 38109 | MEMPHIS | $4,879.55 | Liberty Mutual | $7,826.82 | Allstate | $6,771.37 | USAA | $3,323.82 | State Farm | $3,571.52 |
| 38106 | MEMPHIS | $4,855.29 | Liberty Mutual | $8,470.60 | Allstate | $6,625.68 | USAA | $3,323.82 | State Farm | $3,506.22 |
| 38152 | MEMPHIS | $4,820.32 | Liberty Mutual | $7,958.43 | Allstate | $6,694.41 | USAA | $3,332.11 | State Farm | $3,554.69 |
| 38104 | MEMPHIS | $4,818.28 | Liberty Mutual | $7,759.04 | Allstate | $6,510.51 | USAA | $2,985.60 | State Farm | $3,322.69 |
| 38141 | MEMPHIS | $4,774.38 | Liberty Mutual | $7,560.82 | Farmers | $5,987.91 | USAA | $3,012.48 | Travelers | $3,629.49 |
| 38163 | MEMPHIS | $4,759.35 | Liberty Mutual | $7,958.43 | Allstate | $6,771.01 | State Farm | $3,084.95 | USAA | $3,332.11 |
| 38103 | MEMPHIS | $4,753.52 | Liberty Mutual | $7,759.04 | Allstate | $6,771.33 | USAA | $3,346.64 | State Farm | $3,353.13 |
| 38157 | MEMPHIS | $4,658.50 | Liberty Mutual | $7,958.43 | Farmers | $5,751.99 | State Farm | $3,084.95 | USAA | $3,332.11 |
| 38125 | MEMPHIS | $4,510.60 | Liberty Mutual | $7,560.82 | Allstate | $5,594.06 | USAA | $3,220.10 | State Farm | $3,318.48 |
| 38134 | MEMPHIS | $4,485.52 | Liberty Mutual | $7,813.35 | Allstate | $5,314.94 | USAA | $3,065.06 | State Farm | $3,474.93 |
Cheapest Rates by City in Tennessee
Find your city in the tables below.
| Cheapest Cities in Tennessee | Average by City | Most Expensive Company | Most Expensive Rate | 2nd Most Expensive Company | 2nd Most Expensive Rate | Cheapest Company | Cheapest Rate | 2nd Cheapest Company | 2nd Cheapest Rate |
|---|---|---|---|---|---|---|---|---|---|
| Central | $3,173.65 | Liberty Mutual | $5,266.60 | Allstate | $4,163.63 | State Farm | $2,311.58 | Travelers | $2,392.43 |
| Bristol | $3,176.81 | Liberty Mutual | $5,174.63 | Allstate | $4,087.45 | State Farm | $2,160.43 | USAA | $2,449.19 |
| Unicoi | $3,177.19 | Liberty Mutual | $5,368.79 | Allstate | $4,162.22 | State Farm | $2,283.56 | Travelers | $2,387.75 |
| Johnson City | $3,181.79 | Liberty Mutual | $5,266.60 | Allstate | $4,164.94 | State Farm | $2,347.47 | Travelers | $2,427.98 |
| Mountain Home | $3,188.99 | Liberty Mutual | $5,266.60 | Allstate | $4,189.90 | State Farm | $2,315.51 | Travelers | $2,431.22 |
| Telford | $3,197.59 | Liberty Mutual | $5,266.60 | Allstate | $4,115.87 | State Farm | $2,177.69 | Travelers | $2,422.75 |
| Gray | $3,199.74 | Liberty Mutual | $5,266.60 | Allstate | $4,171.03 | State Farm | $2,267.57 | Travelers | $2,452.07 |
| Elizabethton | $3,200.59 | Liberty Mutual | $5,321.14 | Allstate | $4,163.43 | State Farm | $2,273.92 | Travelers | $2,423.68 |
| Watauga | $3,210.85 | Liberty Mutual | $5,321.14 | Allstate | $4,188.17 | State Farm | $2,271.87 | Travelers | $2,387.21 |
| Banner Hill | $3,212.85 | Liberty Mutual | $5,368.79 | Allstate | $4,134.59 | State Farm | $2,335.93 | Travelers | $2,361.87 |
| Jonesborough | $3,217.01 | Liberty Mutual | $5,266.60 | Allstate | $4,164.05 | State Farm | $2,285.69 | Travelers | $2,451.10 |
| Colonial Heights | $3,220.96 | Liberty Mutual | $4,961.30 | Allstate | $4,187.37 | State Farm | $2,360.95 | USAA | $2,435.57 |
| Flag Pond | $3,222.95 | Liberty Mutual | $5,368.79 | Allstate | $4,134.60 | State Farm | $2,345.30 | Travelers | $2,441.62 |
| Blountville | $3,226.34 | Liberty Mutual | $4,961.30 | Allstate | $4,185.82 | USAA | $2,435.57 | State Farm | $2,439.98 |
| Piney Flats | $3,248.25 | Liberty Mutual | $5,321.14 | Allstate | $4,179.29 | State Farm | $2,377.89 | USAA | $2,435.57 |
| Milligan College | $3,257.45 | Liberty Mutual | $5,266.60 | Allstate | $4,767.24 | State Farm | $2,315.51 | Travelers | $2,463.58 |
| Bluff City | $3,259.15 | Liberty Mutual | $5,321.14 | Allstate | $4,183.25 | State Farm | $2,299.18 | USAA | $2,449.19 |
| Bloomingdale | $3,265.10 | Liberty Mutual | $5,141.66 | Allstate | $4,156.94 | State Farm | $2,403.39 | USAA | $2,435.31 |
| Laurel Bloomery | $3,266.48 | Liberty Mutual | $6,063.27 | Allstate | $4,182.23 | State Farm | $2,315.51 | Travelers | $2,368.74 |
| Shady Valley | $3,269.32 | Liberty Mutual | $6,063.27 | Allstate | $4,189.80 | State Farm | $2,306.69 | Travelers | $2,395.59 |
| Fall Branch | $3,275.84 | Liberty Mutual | $5,141.66 | Allstate | $4,774.39 | State Farm | $2,181.50 | Travelers | $2,579.06 |
| Kingsport | $3,284.52 | Liberty Mutual | $5,293.82 | Allstate | $4,151.32 | USAA | $2,435.28 | State Farm | $2,446.64 |
| Hampton | $3,294.15 | Liberty Mutual | $6,049.58 | Allstate | $4,171.16 | State Farm | $2,296.29 | Travelers | $2,374.93 |
| Roan Mountain | $3,298.94 | Liberty Mutual | $6,049.58 | Allstate | $4,161.78 | State Farm | $2,359.35 | Travelers | $2,406.60 |
| Limestone | $3,308.69 | Liberty Mutual | $5,266.60 | Allstate | $4,767.24 | State Farm | $2,328.90 | Travelers | $2,463.58 |
Central City has the cheapest car insurance rates, while Memphis has the most expensive car insurance rates.
| Most Expensive Cities in Tennessee | Average by City | Most Expensive Company | Most Expensive Rate | 2nd Most Expensive Company | 2nd Most Expensive Rate | Cheapest Company | Cheapest Rate | 2nd Cheapest Company | 2nd Cheapest Rate |
|---|---|---|---|---|---|---|---|---|---|
| Memphis | $4,788.94 | Liberty Mutual | $7,837.10 | Allstate | $6,315.27 | USAA | $3,244.18 | State Farm | $3,520.60 |
| Bartlett | $4,343.08 | Liberty Mutual | $6,987.71 | Allstate | $5,415.78 | USAA | $2,983.87 | State Farm | $3,305.26 |
| Cordova | $4,314.74 | Liberty Mutual | $6,942.75 | Allstate | $5,505.10 | USAA | $2,942.55 | State Farm | $3,306.64 |
| Germantown | $4,184.91 | Liberty Mutual | $7,131.60 | Allstate | $5,452.45 | USAA | $2,556.92 | State Farm | $2,888.53 |
| Millington | $4,172.26 | Liberty Mutual | $6,327.79 | Allstate | $6,287.11 | USAA | $2,744.12 | State Farm | $2,760.02 |
| Arlington | $4,114.08 | Liberty Mutual | $6,916.62 | Allstate | $5,389.19 | USAA | $2,651.42 | State Farm | $2,997.14 |
| Collierville | $4,107.47 | Liberty Mutual | $6,826.31 | Allstate | $5,322.40 | USAA | $2,545.56 | State Farm | $2,989.35 |
| Brighton | $4,105.10 | Liberty Mutual | $6,916.62 | Allstate | $6,287.04 | USAA | $2,955.10 | State Farm | $2,992.03 |
| Ellendale | $4,102.16 | Allstate | $6,402.80 | Liberty Mutual | $5,503.20 | USAA | $2,993.52 | Travelers | $3,054.51 |
| Drummonds | $4,094.22 | Liberty Mutual | $6,916.62 | Allstate | $6,286.94 | State Farm | $2,735.89 | Travelers | $2,947.28 |
| Eads | $4,080.50 | Liberty Mutual | $6,898.36 | Allstate | $5,526.13 | USAA | $2,993.52 | State Farm | $3,052.25 |
| Atoka | $4,075.14 | Liberty Mutual | $6,916.62 | Allstate | $6,287.04 | State Farm | $2,901.72 | USAA | $2,953.34 |
| Munford | $4,056.03 | Liberty Mutual | $6,916.62 | Allstate | $6,287.03 | USAA | $2,837.09 | State Farm | $2,873.36 |
| Burlison | $4,042.45 | Liberty Mutual | $6,576.73 | Allstate | $6,286.90 | State Farm | $2,962.96 | USAA | $2,984.08 |
| Rossville | $4,041.12 | Liberty Mutual | $7,145.14 | Allstate | $5,523.04 | USAA | $2,871.42 | State Farm | $2,910.98 |
| Williston | $4,036.66 | Liberty Mutual | $7,145.14 | Allstate | $5,522.94 | USAA | $2,850.00 | State Farm | $2,860.79 |
| Silerton | $4,029.52 | Liberty Mutual | $8,470.60 | Allstate | $4,808.48 | Travelers | $2,665.25 | State Farm | $2,736.15 |
| Covington | $4,010.68 | Liberty Mutual | $6,576.73 | Allstate | $5,914.04 | State Farm | $2,813.43 | Travelers | $2,911.83 |
| Moscow | $4,004.99 | Liberty Mutual | $7,145.14 | Allstate | $5,522.94 | USAA | $2,850.00 | Travelers | $2,887.17 |
| Oakland | $3,971.25 | Liberty Mutual | $7,145.14 | Allstate | $5,522.98 | State Farm | $2,801.18 | USAA | $2,860.71 |
| Mason | $3,966.47 | Liberty Mutual | $6,576.73 | Allstate | $5,522.93 | State Farm | $2,849.69 | USAA | $2,871.42 |
| Spring Creek | $3,963.50 | Liberty Mutual | $8,470.60 | Allstate | $4,954.71 | State Farm | $2,681.96 | Travelers | $2,857.13 |
| Campaign | $3,945.78 | Liberty Mutual | $8,470.60 | Allstate | $4,666.47 | State Farm | $2,434.85 | USAA | $2,621.85 |
| Brunswick | $3,941.45 | Allstate | $5,524.14 | Liberty Mutual | $5,503.20 | Travelers | $2,518.05 | USAA | $2,744.12 |
| Mc Lemoresville | $3,925.54 | Liberty Mutual | $8,470.60 | Allstate | $4,874.90 | State Farm | $2,509.91 | Travelers | $2,549.48 |
Now that we’ve gone over rates by cities and zip codes, it’s time to get into car insurance company ratings.
Enter your ZIP code below to compare auto insurance rates.
![]() Secured with SHA-256 Encryption
Secured with SHA-256 Encryption
Best Tennessee Car Insurance Companies
With literally hundreds of car insurance companies to choose from, it’s difficult to pick just one to trust with your vehicle, your money, and possibly even your life.
No one has time to sift through hundreds of companies for the best rates; that’s why we already did all the heavy lifting for you. In this section, we will cover things like financial ratings, customer satisfaction ratings, company complaints, and more.
First, let’s cover financial ratings.
Ratings of the Top Ten Largest Car Insurance Companies in Tennessee
| Company | AM Best Rating | Direct Premiums Written | Loss Ratio | Market Share |
|---|---|---|---|---|
| State Farm Group | A++ | $948,604 | 62.03% | 23.23% |
| Tennessee Farmers Group | A+ | $654,613 | 74.33% | 16.03% |
| Geico | A++ | $348,059 | 69.97% | 8.52% |
| Progressive Group | A+ | $311,706 | 61.15% | 7.63% |
| Allstate Insurance Group | A+ | $254,285 | 47.23% | 6.23% |
| USAA Group | A++ | $221,585 | 71.72% | 5.43% |
| Liberty Mutual Group | A | $211,928 | 62.66% | 5.19% |
| Nationwide Corp Group | A+ | $171,166 | 68.01% | 4.19% |
| Erie Insurance Group | A+ | $114,508 | 76.69% | 2.80% |
| Travelers Group | A++ | $84,329 | 64.98% | 2.06% |
The companies above are some of the very best in the business. As you can see, the table shows each company’s AM Best rating. This is another way to measure a company’s financial strength.
Remember how we said to stay away from car insurance companies with a loss ratio percentage outside the bounds of 50-100 percent? Check out Allstate’s low loss percentage ratio; it still has such a high rating.
Companies with the Best Ratings in Tennessee
Customer service is a huge thing to look for when you are interested in finding a new car insurance company. When you’ve just gotten into an accident, you want to make sure you can trust the voice that’s on the other end of the line.
The 2019 U.S. Auto Insurance Study, put together by J.D. Power, now in its 20th year, examines customer satisfaction in five factors (in order of importance): interaction; policy offerings; price; billing process and policy information; and claims.
Let’s have a look at some of the best-rated car insurance companies in Tennessee’s region.
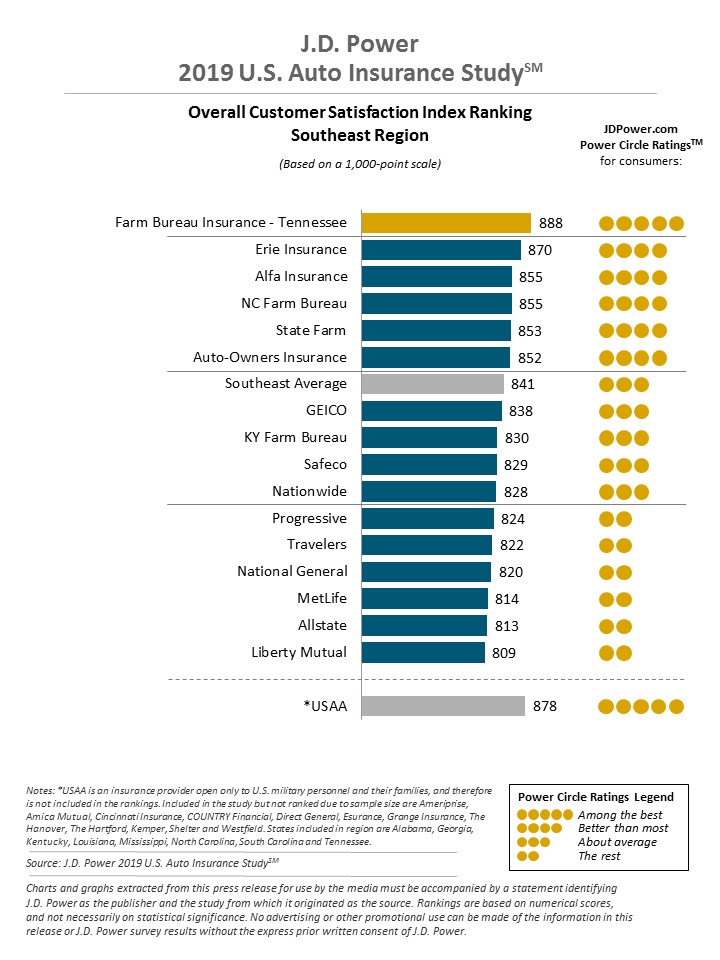
The study is based on responses from 42,759 auto insurance customers and was fielded from February through April 2019.
According to this chart, Farm Bureau Insurance of Tennessee was the best-rated car insurance company in the Southeast region of the U.S.
Companies with the Most Complaints in Tennessee
The company complaint data below is collected from the NAIC.
| Company | National Median Complaint Ratio | Company Complaint Ratio 2017 | Total Complaints 2017 |
|---|---|---|---|
| State Farm Group | 1 | 0.44 | 1482 |
| Tennessee Farmers Group | 1 | 0.67 | 39 |
| Geico | N/A | 0.007 | 6 |
| Progressive Group | 1 | 0.75 | 120 |
| Allstate Insurance Group | 1 | 0.5 | 163 |
| USAA Group | N/A | 0 | 2 |
| Liberty Mutual Group | 1 | 5.95 | 222 |
| Nationwide Corp Group | 1 | 0.28 | 25 |
| Erie Insurance Group | 1 | 0.7 | 22 |
| Travelers Group | 1 | 0.09 | 2 |
Every company receives complaints; how a company handles a complaint after it is received is what truly matters.
Cheapest Companies in Tennessee
| Company | Average | Compared to State Average | Percentage Compared to State Average |
|---|---|---|---|
| Allstate P&C | $4,828.85 | $1,167.96 | 24.19% |
| Mid-Century Ins Co | $3,430.07 | -$230.82 | -6.73% |
| Geico General | $3,283.42 | -$377.47 | -11.50% |
| SAFECO Ins Co of IL | $6,206.69 | $2,545.80 | 41.02% |
| Nationwide Mutual | $3,424.96 | -$235.93 | -6.89% |
| Progressive Hawaii | $3,656.91 | -$3.98 | -0.11% |
| State Farm Mutual Auto | $2,639.30 | -$1,021.59 | -38.71% |
| Travelers Prop Cas Ins Co | $2,738.52 | -$922.37 | -33.68% |
| USAA | $2,739.28 | -$921.60 | -33.64% |
The data above says that Travelers Prop Cas Ins Co and USAA have the cheapest insurance plans in Tennessee. But keep in mind that USAA only services men and women and families in the military.
Commute Rates by Companies
Did you know that distance can affect your car insurance rate?
| Group | 10 Miles Commute, 6000 Annual Mileage | 25 Miles Commute, 12000 Annual Mileage |
|---|---|---|
| Allstate | $4,828.85 | $4,828.85 |
| Farmers | $3,430.06 | $3,430.06 |
| Geico | $3,263.57 | $3,303.27 |
| Liberty Mutual | $6,206.69 | $6,206.69 |
| Nationwide | $3,424.96 | $3,424.96 |
| Progressive | $3,656.91 | $3,656.91 |
| State Farm | $2,576.56 | $2,702.04 |
| Travelers | $2,630.93 | $2,846.10 |
| USAA | $2,661.90 | $2,816.66 |
Surprisingly, most of these rates are the same – but if you’re looking at companies with great rates even if you spend a lot of your life in your car, try going with Allstate or Farmers Auto Insurance.
Coverage Level Rates by Companies
Sometimes car insurance companies will give you a break on your rate if they know you are going to purchase more insurance. Check it out in the table below to see what we mean.
| Group | Low Coverage | Medium Coverage | High Coverage |
|---|---|---|---|
| Allstate | $4,645.25 | $4,816.41 | $5,024.87 |
| Farmers | $3,236.69 | $3,413.80 | $3,639.71 |
| Geico | $3,125.46 | $3,276.37 | $3,448.43 |
| Liberty Mutual | $5,938.19 | $6,204.78 | $6,477.10 |
| Nationwide | $3,450.27 | $3,350.97 | $3,473.64 |
| Progressive | $3,428.80 | $3,657.30 | $3,884.63 |
| State Farm | $2,492.73 | $2,651.21 | $2,773.95 |
| Travelers | $2,576.37 | $2,736.50 | $2,902.69 |
| USAA | $2,651.70 | $2,729.45 | $2,836.70 |
Take Nationwide for example. It’s only $23 more a year to have high coverage instead of low coverage. That’s a pretty great deal.
Credit History Rates by Companies
Unfortunately, a bad credit score can leave you paying a lot of green for your car insurance policy.
| Group | Poor Credit History | Fair Credit History | Good Credit History |
|---|---|---|---|
| Allstate | $6,163.68 | $4,718.43 | $3,604.43 |
| Farmers | $4,079.54 | $3,191.56 | $3,019.09 |
| Geico | $3,726.36 | $3,190.30 | $2,933.59 |
| Liberty Mutual | $8,898.63 | $5,455.32 | $4,266.12 |
| Nationwide | $4,115.26 | $3,265.47 | $2,894.15 |
| Progressive | $4,110.86 | $3,545.77 | $3,314.09 |
| State Farm | $3,832.98 | $2,299.30 | $1,785.62 |
| Travelers | $3,483.87 | $2,735.47 | $1,996.22 |
| USAA | $3,972.56 | $2,326.47 | $1,918.82 |
In 2017, Tennessee’s average credit score was 662. That’s 13 points lower than the national average.
Car insurance check your past credit score history because they want to know if you pay your bills on time. If you keep a good credit history, your rates are likely to stay lower.
According to the table above, a bad credit score can add thousands of dollars more to your car insurance rate.
But let’s move onto the biggest rate factor out there: driving record.
Driving Record Rates by Companies
Probably the most important question you will be asked by an insurance provider is “have you ever been in an accident or gotten a speeding ticket?”
If your answer is yes, you’re most likely going to have a higher than average car insurance rate.
| Group | Clean Record | With 1 speeding violation | With 1 accident | With 1 DUI |
|---|---|---|---|---|
| Allstate | $4,043.94 | $4,625.86 | $4,821.64 | $5,823.95 |
| Farmers | $2,930.61 | $3,457.46 | $3,622.99 | $3,709.20 |
| Geico | $2,386.13 | $2,386.13 | $3,197.12 | $5,164.31 |
| Liberty Mutual | $5,031.00 | $5,789.80 | $7,257.06 | $6,748.89 |
| Nationwide | $2,961.85 | $3,322.14 | $2,961.85 | $4,454.01 |
| Progressive | $3,221.09 | $3,794.09 | $4,182.08 | $3,430.36 |
| State Farm | $2,406.95 | $2,639.30 | $2,871.65 | $2,639.30 |
| Travelers | $2,220.52 | $2,731.56 | $2,851.81 | $3,150.18 |
| USAA | $1,992.65 | $2,470.89 | $2,984.18 | $3,509.42 |
Drinking and driving is against the law, and being charged with just one DUI can literally cost you thousands of dollars more a year on your car insurance policy.
How Much Auto Insurance Costs in Tennessee
Explore the varying costs of auto insurance across different cities in Tennessee and uncover the most affordable options tailored to your location. Whether you reside in Chattanooga, Clarksville, Knoxville, Memphis, or Nashville, this guide provides insights into finding the cheapest insurance rates specific to your city, ensuring you make informed decisions to protect your vehicle without breaking the bank.
| Find the Cheapest Insurance in Your City |
|---|
| Chattanooga, TN |
| Clarksville, TN |
| Knoxville, TN |
| Memphis, TN |
| Nashville, TN |
Number of Insurers in Tennessee
| Domestic | Foreign | Total Number of Licensed Insurers |
|---|---|---|
| 15 | 930 | 945 |
What’s the difference between domestic and foreign insurance laws?
Domestic laws are formed under the laws of the state, while foreign laws are formed under the laws of the United States.
Tennessee State Laws
There are hundreds and hundreds of state laws in Tennessee, so we don’t expect you to know them all; but, it’s very important to be aware of state driving laws.
To help you stay safe while on the road, this next section is dedicated to safety laws, rules of the road, distracted driving laws, weird driving laws, and more.
If you want to keep your rates low and your wallet full, this next section is for you because if you don’t know these laws, you are at risk of falling victim to a traffic ticket – and nobody wants that.
Tennessee Car Insurance Laws
By now you should know that Tennessee requires all drivers to carry a car insurance policy. However, different states have different car insurance laws.
How are these laws created and who creates them?
How State Laws for Insurance are Determined
According to the NAIC, state laws have a considerable influence on auto insurance.
Each state determines the type of tort law and threshold (if any) that applies in the state, the type and amount of liability insurance required, and the system used for approval of insurer rates and forms.
The states employ a variety of rate regulation mechanisms:
- Determined by Commissioner
- Prior approval
- Modified prior approval
- Flex rating
- File and use
- Use and file
- No file
Tennessee uses two processes to file new car insurance laws. Form filings need prior approval (30-day deemer plus 30-day extension).
What does prior approval mean?
Rates/forms must be filed with and approved by the state insurance department before they can be used. Approval can be by means of a deemer provision, which indicates approval if rates/forms are not denied within a specified number of days.
If you want to read about rate filings, check out the Tennessee Code Title 56. Insurance § 56-5-307.
Windshield Coverage
Unfortunately for Tennesseans, there aren’t any laws about windshield coverage or repairs. However, some car insurance companies might have a windshield coverage plan included in a comprehensive policy.
High-Risk Insurance
Car accidents happen, and that’s exactly why car insurance was invented in the first place. But if you have been in an accident, you may need to apply for high-risk insurance or SR22 insurance.
What are some other reasons you may need to get SR22 insurance?
- Being convicted of a DUI
- Driving without insurance
- Being convicted of a serious traffic violation
- Having points on your driving record
What is SR22 insurance in Tennessee?
A SR-22 form is proof of future financial responsibility as required under Tennessee Code Annotated 55-12-114. If you are required to file a SR-22, then you should contact your liability insurance representative and advise them of the needed filing with our state.
According to the Tennessee Department of Safety and Homeland Security, an SR-22 can be required for a total of five years from your date of suspension.
If the SR-22 is filed for a total of three years (36 months) within the five-year period, the SR-22 may be canceled provided it is not required on any other suspension.
If five years pass from the date of suspension before you reinstate your privileges, then the SR-22 would not be required. If the SR-22 is canceled before the required time and a new form not filed, your driving privileges will be suspended.
Low Income Car Insurance Program
There are only three states in the U.S. that have a low-income car insurance program and Tennessee is not one of them.
Don’t be discouraged by this. If you’re still looking for more ways to save on your insurance policy, ask your current provider if you qualify for any of the discounts found below.
- Good driver discount
- Homeowner’s discount
- Military discount
- Multi-car discount
- Student discount
Looking for even more ways to save? Use our free tool right now by entering your zip in the box below.
Free Auto Insurance Comparison
Enter your ZIP code below to compare auto insurance rates.
![]() Secured with SHA-256 Encryption
Secured with SHA-256 Encryption
Automobile Insurance Fraud in Tennessee
Auto insurance fraud is a serious crime in the state of Tennessee — but what is insurance fraud mean exactly?
According to the Insurance Information Institute, Insurance fraud can be “hard” or “soft.” Hard fraud occurs when someone deliberately fabricates claims or fakes an accident.
Soft insurance fraud, also known as opportunistic fraud, occurs when people pad legitimate claims, for example, or, in the case of business owners, list fewer employees or misrepresent the work they do to pay lower premiums for workers’ compensation.
If you’re caught committing insurance fraud, you could be facing jail time.
Wondering how not to commit insurance fraud?
Don’t pad your claims, and don’t intentionally cause an accident.
If you have more questions about insurance fraud, or you’d like to get in touch with the Tennessee Department of Commerce & Insurance, visit tn.gov or give them a call at (615)741-2241.
You can also visit the office at the address listed below.
500 James Robertson Pkwy Nashville, TN 37243.
Statute of Limitations
The statute of limitations law means victims of car accidents only have a specific amount of time to file a claim with their insurance policy.
This protects both the victim and the insurance company by giving the victim ample time to file a claim and by making sure a victim doesn’t wait fifteen years to file a claim just to pick a fight with the insurance company.
In Tennessee, car accident victims have just one year to file a personal injury claim and three years to file a property damage claim.
Keep in mind – you have one or three year(s) to file a claim from the day of your accident.
Don’t wait to file your claims! Car insurance exists to help you out when you’ve been in an accident, so there’s really no reason to wait a long time anyway.
Tennessee State Specific Laws
One weird state-specific driving law in Tennessee is that you may not drive while you’re asleep. As tempting as it may be, please don’t drive while sleeping. You’ll face some serious jail time, and will most likely kill yourself if you do.
Vehicle Licensing Laws
Have you ever heard of a REAL ID?
By October of 2020, Tennesee residents must carry a REAL ID to get through airport security and board a domestic flight.
You must also carry a REAL ID if you wish to visit any federal sites. If you don’t wish to use a REAL ID, a valid passport can be used instead.
Penalities for Driving Without Insurance
Trust us; we know that skipping out on car insurance might seem like an easy thing that will save you money in the long run, but actually, it doesn’t.
Why? Because driving without car insurance is illegal in Tennessee.
Still don’t believe us? Take a look at the penalties for driving without car insurance listed below. This is what happens when you get caught driving without insurance the first time.
- Pay a $300 fine
- Driver’s license and registration suspended until insurance proof provided and driver’s license examination retaken
- $65 restoration fee; $50 fee to commissioner of safety; SR-22 certificate for three years
What if you actually do have car insurance, but you don’t have proof of insurance? There are penalties for that too.
- $25 coverage failure fee after 15 days; an additional $100 continued coverage failure fee after an additional 30 days
- Driver’s license and registration suspended after 45 days until proof provided
- $65 license and registration restoration fee; $50 fee to commissioner of safety
The information above is pulled from the Tennesee Department of Revenue.
Let’s go back again and review acceptable forms of proof of car insurance. When a law enforcement officer pulls you over and asks for proof of insurance, license, and registration, you are obligated to provide him or her with these important documents.
- Valid liability insurance ID cards
- Copy of your current car’s insurance policy
- Valid insurance binder (a temporary form of car insurance)
- Picture of proof of insurance on your smartphone
Why did we choose to show all of these penalties? We want you to know as a Tennessee driver that it is cheaper in fact, to carry a car insurance policy.
Teen Driver Laws
The information below is collected from the IIHS.
Good news for young Tennessee drivers! To start driver’s education classes and obtain a permit in the state of Tennessee, you must be at least 15 years old.
You must be at least 16 years old to obtain a restricted driver’s license.
| Requirements for Getting a Tennessee License | Details |
|---|---|
| Mandatory Holding Period | 6 months |
| Minimum Supervised Driving Time | 50 hours, 10 of which must be at night |
| Minimum Age | 16 |
Look at the table below for restricted license laws.
| Restricted Drivers License Rules | Details |
|---|---|
| Nighttime restrictions | 11 p.m.-6 a.m. |
| Passenger restrictions (family members excepted unless noted otherwise) | no more than 1 passenger |
| Minimum age at which restrictions may be lifted | |
| Nighttime restrictions | 12 months or until age 18, whichever occurs first (min. age: 17) |
| Passenger restrictions | 12 months or until age 18, whichever occurs first (min. age: 17) |
Driver License Renewal Procedures
Whether you’re 18 years old or eighty years old, all Tennessee drivers must renew their licenses every eight years.
The state of Tennessee does not require drivers to have proof of adequate vision when renewing a driver’s license.
Save a trip to the Tennessee DMV and renew your license online or by mail. All ages are allowed to renew licenses online or by mail.
New Residents
If you are a new resident in the state of Tennessee or you are thinking about moving to Tennessee in the near future, this section is for you.
New residents or those returning to Tennessee and holding a driver license from another state must obtain a Tennessee driver license no later than 30 days after establishing residency.
When applying for a Tennessee license, drivers must present the following:
- Your current license (or certified copy of driving record or other acceptable ID)
- Proof of name change, such as original certified court order, marriage certificate, or divorce decree
- Two Proofs of Tennessee Residency with your name and resident address
- Proof of U.S. citizenship or lawful permanent resident status
- A Social Security Number or sworn affidavit if no Social Security number has been issued
Don’t forget to update your insurance company and let them know you are moving out of state and will need Tennesee car insurance.
Tennessee minimum car insurance requirements are:
- $25,000 liability coverage for bodily injury or death of one person in an accident caused by the owner/driver of the insured vehicle
- $50,000 liability coverage for total bodily injury or death liability in an accident caused by the owner/driver of the insured vehicle
- $15,000 liability coverage for property damage per accident caused by the owner/driver of the insured vehicle
Some companies don’t provide car insurance in every state in the U.S., so it’s extremely important to find this out before you move.
Negligent Operator Treatment System (NOTS)
In Tennessee, “negligent” or reckless driving is a class B misdemeanor. Convicted drivers are looking at up to six months in jail and a maximum of $580 in fines.
Any motorist who racks up two reckless driving convictions within a one-year period faces a 12-month license suspension.
Reckless driving in Tennessee can be defined as:
- driving in “willful or wanton disregard for the safety of persons or property”
- doing a wheelie on a motorcycle in willful or wanton disregard for the safety of a person or property
- driving into a flooded area that is clearly marked with a warning sign or barricade
A reckless driving conviction will also add six demerit points to the motorist’s driving record. Accumulating 12 or more points in a year can lead to a license suspension of 6-12 months.
Rules of the Road in Tennessee
Are you unsure about Tennessee’s rules of the road? Not knowing simple rules of the road could potentially cause you to rack up points on your driving record, cause you to get into a car accident, or worse.
In this next section, we go over speed limit laws, car seat and seat belt laws, safety laws and more — so buckle up as we fly through these important Tennessee rules of the road.
Fault vs No-Fault
As we’ve already stated above, Tennessee is an at-fault state.
Simply put, if you cause an accident and damage another person’s vehicle or cause them to need medical intervention, you are responsible for covering all costs of damages and medical bills resulting from that accident.
If you break it, you buy it, and that’s all there is to it.
It’s so important to have insurance because having the right policy can save you from having to pay to cover damage repairs out of your own pocket.
Seat Belt and Car Seat Laws
The information below is brought to you by the IIHS.
Every state seat belt law is different – avoid having to pay a hefty penalty fine by knowing these seat belt laws below.
| Tennessee Seat Belt Laws | Details |
|---|---|
| Effective Since | April 21, 1986 |
| Primary Enforcement | yes; effective 07/01/04 |
| Age/Seats Applicable | 16+ years in front seat |
| 1st Offense Max Fine | $30 |
Tennessee also wants children to be safe while traveling on the road. Look at the table below to find out more about Tennessee car seat laws.
| Type of Car Seat Required | Age |
|---|---|
| Rear-Facing Child Restraint | younger than 1 year or 20 pounds or less in a rear-facing child restraint |
| Forward-Facing Child Restraint | 1 through 3 years and 20+ pounds in a forward-facing child restraint |
| Child Booster Seat | 4 through 8 years and less than 4'9" in a booster seat |
| Adult Belt Permissible | 9 through 15 years or any child 12 or younger who is 4'9" or taller |
Children 8 years and younger and less than 4’9″ must be in the rear seat if available. A rear seat is recommended for children ages 9-12.
If you’re caught breaking a car seat law, the fine is $50, plus fees.
There are also restrictions on riding in the cargo area of a pick-up truck.
You will not be covered by your insurance if you are in an accident while riding in the bed of a pick-up truck if the following applies:
- People 12 and older
- people 6-11 in a vehicle being operated off the interstate or state highway system
- parades if vehicle going less than 20 mph
- agricultural activities or on city or county roads unless prohibited by local ordinance or resolution
Keep Right and Move Over Laws
We’ve all heard of keep right or move over laws, right?
In Tennessee, you’re supposed to move right to let faster traffic pass if you’re blocking traffic in the left lane.
According to AAA, state law requires drivers approaching a stationary authorized emergency, utility vehicle, municipal vehicle, road maintenance vehicle, or a tow truck or recovery vehicle, displaying flashing lights and traveling in the same direction, to reduce speed and, if safe to do so, vacate the lane closest to the vehicles.
Speed Limit Laws
Always pay attention to speed limit laws. They are set in place for a reason – to keep you and your family as safe as possible while on the road.
Check out the table below for Tennessee’s speed limit laws.
| Type of Roadway | Speed Limit |
|---|---|
| Rural Interstates | 70 mph |
| Urban Interstates | 70 mph |
| Other Limited Access Roads | 70 mph |
| Other Roads | 65 mph |
Keep in mind that these limits listed above are the maximum speeds you may drive on Tennessee roads.
Ridesharing
Have you ever heard of ridesharing services like Uber or Lyft? If you are a ridesharing employee, you must have what is called ridesharing insurance.
Car insurance companies know that the more you drive, the more likely you are to get into a car accident.
Need Tennessee ridesharing car insurance, but you’re not sure where to start shopping for it?
Check out the companies listed below to get started.
- Allstate
- Erie
- Farmers
- Geico
- Liberty Mutual
- State Farm
- USAA
Remember that not every insurance company provides ridesharing insurance and it is the right of a company to refuse to insure you if you are a candidate for ridesharing insurance.
Automation on the Road
What is automation on the road?
According to the IIHS, in driving, automation involves using radar, camera, and other sensors to perform parts or all of the driving task on a sustained basis instead of the driver.
One example is adaptive cruise control, which continually adjusts the vehicle’s speed to maintain a set minimum following distance.
Features such as automatic braking acts as a back-up if the human driver fails to brake, or blind-spot detection, which provides additional information to the driver, aren’t considered automation under this definition.
The NCSL states that Tennessee has a new law that prohibits local governments from banning the use of motor vehicles equipped with autonomous technology. Vehicle automation is currently in deployment.
The IIHS also states that an operator of an automated vehicle does not need to be licensed, and there doesn’t need to be an operator inside an automated vehicle, however, automated vehicles must have minimum liability insurance of at least $5,000,000.
Safety Laws in Tennessee
This next section will cover laws regarding impaired driving, drunk driving laws, and penalties, and distracted driving laws in Tennessee.
First, let’s talk about a devastating unlawful activity: drinking and driving.
DUI Laws
The information below on DUI laws and penalties is pulled directly from responsibility.org.
Nearly 3,000 Tennessee drivers have lost their lives to drinking and driving over the last ten years — which is exactly why there are strict laws against drinking and driving.
| Name for Offense | Driving under the influence (DUI) |
|---|---|
| BAC Limit | 0.08 |
| High BAC Limit | 0.2 |
| Criminal Status | 1st-3rd class A misdemeanors, 4th+ in 10 years class E felony |
| Look Back Period | 10 years |
Listed below are DUI penalties based on the number of offense.
| Number of Offense | ALS or Revocation | Imprisonment | Fine | Other |
|---|---|---|---|---|
| 1st Offense | 1 year | 48 hours - 11 months; HBAC: min 7 consecutive days | $350-$1500 | DUI school required, court may require IID and/or addiction treatment |
| 2nd Offense | 2 years, restricted license available after 1 year | 45 days - 11 months | $600-$10,000 | DUI school required, possible vehicle seizure, treatment may be required by court, IID required for 6 months after license reinstatement |
| 3rd Offense | 6-10 years and no restricted license available | 120 days - 11 months | $1100-$10000 | DUI school required, possible vehicle seizure, IID required for 6 months after license reinstatement, treatment may be required by court |
| 4th Offense | 5 years and no restricted license available | 1 year with minimum 150 consecutive days served | $3000-$15000 | possble vehicle seizure, DUI school required, treatment may be required by court, IID required for 6 months after license reinstatement |
These penalties may be strict, but they are enforced for good reason.
Marijuana-Impaired Driving Laws
At this time, there aren’t any marijuana-specific drugged driving laws in Tennessee, but just because you can’t specifically be pulled over for marijuana use doesn’t mean you can’t be pulled over for impaired driving.
If you are caught driving while impaired, you could be facing jail time and you may be required to pay a fine.
Distracted Driving Laws
Technology can be a great tool in many cases, but using a cell phone while driving has become a huge distraction and the culprit for causing many car accidents.
In case you didn’t know or needed to be reminded, texting and driving is against the law in the state of Tennessee.
| Hand-held ban | Young drivers all cellphone ban | Texting ban | Enforcement |
|---|---|---|---|
| all drivers | learner's permit and intermediate license holders | all drivers | primary |
Don’t risk running yourself or someone else off the road because of a text! It can wait!
Driving in Tennessee
Now that we’ve covered Tennesse driving and safety laws, insurance laws, and rules of the road, it’s time to discuss traffic fatality trends, traffic congestion, and vehicle theft.
Knowing these traffic risks can help you avoid accidents, dangerous areas, traffic, and more.
You always have the advantage if you’re aware of your surroundings — let’s talk about vehicle theft trends first.
Vehicle Theft in Tennessee
How do you know if your vehicle is on Tennessee’s most-stolen car list? Check out the table below to see if your vehicle is at risk of being stolen.
Keep in mind that the vehicle year listed is the most popular model year stolen.
| Make/Model | Year of Vehicle | Number of Thefts |
|---|---|---|
| Chevrolet Pickup (Full Size) | 1997 | 693 |
| Ford Pickup (Full Size) | 2004 | 468 |
| Honda Accord | 1996 | 267 |
| Nissan Altima | 2005 | 215 |
| Chevrolet Impala | 2007 | 213 |
| GMC Pickup (Full Size) | 1996 | 201 |
| Honda Civic | 2000 | 198 |
| Nissan Maxima | 1997 | 188 |
| Toyota Camry | 2007 | 188 |
| Jeep Cherokee/Grand Cherokee | 2000 | 178 |
Below is the FBI‘s data on cities in Tennessee with the most car theft.
| City | Motor vehicle theft |
|---|---|
| Adamsville | 5 |
| Alamo | 2 |
| Alcoa | 49 |
| Alexandria | 3 |
| Algood | 2 |
| Ardmore | 0 |
| Ashland City | 13 |
| Athens | 77 |
| Atoka | 3 |
| Baileyton | 2 |
| Bartlett | 57 |
| Baxter | 2 |
| Bean Station | 6 |
| Belle Meade | 2 |
| Bells | 3 |
| Benton | 1 |
| Berry Hill | 2 |
| Big Sandy | 1 |
| Blaine | 2 |
| Bluff City | 8 |
| Bolivar | 18 |
| Bradford | 0 |
| Brentwood | 17 |
| Brighton | 5 |
| Bristol | 74 |
| Brownsville | 23 |
| Bruceton | 1 |
| Burns | 0 |
| Calhoun | 0 |
| Camden | 6 |
| Carthage | 1 |
| Caryville | 15 |
| Celina | 2 |
| Centerville | 2 |
| Chapel Hill | 0 |
| Charleston | 0 |
| Chattanooga | 1,342 |
| Church Hill | 4 |
| Clarksburg | 0 |
| Clarksville | 241 |
| Cleveland | 225 |
| Clifton | 2 |
| Clinton | 48 |
| Collegedale | 15 |
| Collierville | 31 |
| Collinwood | 3 |
| Columbia | 79 |
| Cookeville | 135 |
| Coopertown | 1 |
| Cornersville | 1 |
| Covington | 24 |
| Cowan | 1 |
| Cross Plains | 1 |
| Crossville | 55 |
| Crump | 3 |
| Cumberland City | 0 |
| Dandridge | 4 |
| Dayton | 12 |
| Decatur | 9 |
| Decaturville | 3 |
| Decherd | 0 |
| Dickson | 55 |
| Dover | 0 |
| Dresden | 2 |
| Dunlap | 31 |
| Dyer | 4 |
| Dyersburg | 44 |
| Eagleville | 0 |
| East Ridge | 91 |
| Elizabethton | 37 |
| Elkton | 0 |
| Englewood | 9 |
| Erin | 0 |
| Erwin | 9 |
| Estill Springs | 3 |
| Ethridge | 0 |
| Etowah | 11 |
| Fairview | 6 |
| Fayetteville | 23 |
| Franklin | 30 |
| Friendship | 0 |
| Gadsden | 0 |
| Gainesboro | 1 |
| Gallatin | 22 |
| Gallaway | 2 |
| Gates | 0 |
| Gatlinburg | 17 |
| Germantown | 27 |
| Gibson | 0 |
| Gleason | 2 |
| Goodlettsville | 31 |
| Gordonsville | 7 |
| Grand Junction | 0 |
| Graysville | 0 |
| Greenbrier | 7 |
| Greeneville | 66 |
| Greenfield | 0 |
| Harriman | 19 |
| Henderson | 3 |
| Hendersonville | 44 |
| Henry | 2 |
| Hohenwald | 22 |
| Hollow Rock | 0 |
| Hornbeak | 0 |
| Humboldt | 12 |
| Huntingdon | 4 |
| Jacksboro | 0 |
| Jackson | 149 |
| Jamestown | 0 |
| Jasper | 9 |
| Jefferson City | 10 |
| Jellico | 6 |
| Johnson City | 158 |
| Jonesborough | 7 |
| Kenton | 0 |
| Kimball | 6 |
| Kingsport | 204 |
| Kingston | 10 |
| Kingston Springs | 0 |
| Knoxville | 1,036 |
| Lafayette | 15 |
| La Follette | 26 |
| Lawrenceburg | 27 |
| Lebanon | 84 |
| Lenoir City | 22 |
| Lewisburg | 12 |
| Lexington | 27 |
| Livingston | 6 |
| Lookout Mountain | 0 |
| Loretto | 6 |
| Loudon | 5 |
| Madisonville | 25 |
| Manchester | 19 |
| Martin | 5 |
| Maryville | 44 |
| Mason | 2 |
| Maury City | 2 |
| Maynardville | 6 |
| McEwen | 2 |
| McKenzie | 5 |
| McMinnville | 42 |
| Medina | 2 |
| Memphis | 4,002 |
| Middleton | 1 |
| Milan | 8 |
| Millersville | 7 |
| Millington | 40 |
| Minor Hill | 0 |
| Monteagle | 1 |
| Monterey | 12 |
| Morristown | 111 |
| Moscow | 0 |
| Mountain City | 1 |
| Mount Carmel | 3 |
| Mount Juliet | 52 |
| Mount Pleasant | 11 |
| Munford | 8 |
| Murfreesboro | 269 |
| Nashville Metropolitan | 2,565 |
| Newbern | 1 |
| New Johnsonville | 1 |
| New Market | 2 |
| Newport | 32 |
| New Tazewell | 9 |
| Niota | 3 |
| Nolensville | 3 |
| Norris | 3 |
| Oakland | 0 |
| Oak Ridge | 65 |
| Obion | 1 |
| Oliver Springs | 18 |
| Oneida | 8 |
| Paris | 25 |
| Parsons | 3 |
| Petersburg | 0 |
| Pigeon Forge | 62 |
| Pikeville | 5 |
| Piperton | 3 |
| Pittman Center | 1 |
| Plainview | 2 |
| Pleasant View | 6 |
| Portland | 11 |
| Pulaski | 13 |
| Puryear | 1 |
| Red Bank | 36 |
| Red Boiling Springs | 3 |
| Ridgely | 3 |
| Ridgetop | 0 |
| Ripley | 8 |
| Rockwood | 24 |
| Rocky Top | 23 |
| Rogersville | 8 |
| Rossville | 1 |
| Rutherford | 1 |
| Rutledge | 2 |
| Saltillo | 6 |
| Savannah | 28 |
| Scotts Hill | 3 |
| Selmer | 8 |
| Sevierville | 67 |
| Sharon | 1 |
| Shelbyville | 47 |
| Signal Mountain | 0 |
| Smithville | 15 |
| Smyrna | 106 |
| Sneedville | 2 |
| Soddy-Daisy | 26 |
| Somerville | 5 |
| South Carthage | 1 |
| South Fulton | 1 |
| South Pittsburg | 6 |
| Sparta | 13 |
| Spencer | 1 |
| Spring City | 0 |
| Springfield | 31 |
| Spring Hill | 11 |
| St. Joseph | 0 |
| Sunbright | 0 |
| Surgoinsville | 1 |
| Sweetwater | 24 |
| Tazewell | 8 |
| Tellico Plains | 6 |
| Tiptonville | 2 |
| Toone | 0 |
| Townsend | 1 |
| Tracy City | 8 |
| Trenton | 0 |
| Trezevant | 0 |
| Trimble | 0 |
| Troy | 0 |
| Tullahoma | 29 |
| Tusculum | 1 |
| Union City | 27 |
| Vonore | 7 |
| Wartburg | 1 |
| Wartrace | 0 |
| Watertown | 0 |
| Waverly | 8 |
| Waynesboro | 6 |
| Westmoreland | 1 |
| White Bluff | 2 |
| White House | 10 |
| White Pine | 3 |
| Whiteville | 1 |
| Whitwell | 9 |
| Winchester | 14 |
| Winfield | 0 |
| Woodbury | 5 |
Some of these cities reported zero theft in 2017 – that is not a typo, that’s a fact.
Road Fatalities in Tennessee
Let’s move onto a topic that is a little more depressing: traffic fatalities. How do they happen? What causes them to happen? Are some vehicles more likely to be involved in a traffic fatality than others?
All these statistics and more are covered up next.
Fatal Crashes by Weather Condition and Light Condition
Did the weather have anything to do with the traffic fatality rate in Tennessee?
| Weather Condition | Daylight | Dark, but Lighted | Dark | Dawn or Dusk | Other / Unknown | Total |
|---|---|---|---|---|---|---|
| Normal | 443 | 134 | 236 | 22 | 3 | 838 |
| Rain | 51 | 18 | 24 | 3 | 0 | 96 |
| Snow/Sleet | 1 | 0 | 1 | 0 | 0 | 2 |
| Other | 1 | 4 | 6 | 3 | 0 | 14 |
| Unknown | 2 | 1 | 2 | 0 | 4 | 9 |
| TOTAL | 498 | 157 | 269 | 28 | 7 | 959 |
According to the table above, most traffic fatalities happened in broad daylight without any major weather conditions.
Fatalities (All Crashes) by County
Did more fatalities happen in some counties than others?
| County | Fatalities 2013 | 2014 | 2015 | 2016 | 2017 | Fatalities Per 100K Population 2013 | 2014 | 2015 | 2016 | 2017 |
|---|---|---|---|---|---|---|---|---|---|---|
| Anderson County | 10 | 18 | 6 | 15 | 11 | 13.29 | 23.96 | 7.95 | 19.85 | 14.42 |
| Bedford County | 15 | 9 | 12 | 7 | 4 | 32.91 | 19.46 | 25.59 | 14.76 | 8.31 |
| Benton County | 11 | 6 | 5 | 3 | 2 | 67.25 | 37.09 | 30.88 | 18.68 | 12.51 |
| Bledsoe County | 0 | 0 | 1 | 0 | 7 | 0 | 0 | 6.9 | 0 | 47.56 |
| Blount County | 25 | 23 | 27 | 18 | 16 | 20.02 | 18.28 | 21.29 | 14.04 | 12.31 |
| Bradley County | 8 | 9 | 20 | 11 | 15 | 7.86 | 8.75 | 19.27 | 10.54 | 14.21 |
| Campbell County | 9 | 12 | 15 | 11 | 1 | 22.38 | 30.08 | 37.8 | 27.73 | 2.52 |
| Cannon County | 3 | 0 | 6 | 1 | 3 | 21.89 | 0 | 43.62 | 7.19 | 21.1 |
| Carroll County | 9 | 7 | 4 | 6 | 5 | 31.48 | 24.68 | 14.31 | 21.49 | 17.95 |
| Carter County | 6 | 3 | 6 | 7 | 5 | 10.54 | 5.33 | 10.64 | 12.4 | 8.85 |
| Cheatham County | 4 | 7 | 6 | 5 | 7 | 10.17 | 17.67 | 15.16 | 12.59 | 17.36 |
| Chester County | 3 | 3 | 3 | 1 | 1 | 17.57 | 17.54 | 17.56 | 5.85 | 5.84 |
| Claiborne County | 6 | 9 | 5 | 11 | 5 | 18.98 | 28.55 | 15.86 | 34.85 | 15.82 |
| Clay County | 2 | 1 | 1 | 2 | 2 | 25.95 | 13.09 | 13.02 | 26.01 | 25.96 |
| Cocke County | 10 | 6 | 8 | 11 | 3 | 28.31 | 17.04 | 22.81 | 31.29 | 8.44 |
| Coffee County | 10 | 12 | 14 | 13 | 17 | 18.76 | 22.42 | 25.88 | 23.88 | 30.89 |
| Crockett County | 3 | 2 | 2 | 2 | 3 | 20.54 | 13.66 | 13.72 | 13.82 | 20.73 |
| Cumberland County | 11 | 9 | 15 | 19 | 7 | 19.19 | 15.56 | 25.81 | 32.46 | 11.85 |
| Davidson County | 71 | 64 | 76 | 71 | 75 | 10.76 | 9.55 | 11.16 | 10.31 | 10.85 |
| Decatur County | 2 | 4 | 1 | 3 | 8 | 17.15 | 34.25 | 8.62 | 25.62 | 68.08 |
| Dekalb County | 6 | 3 | 5 | 1 | 6 | 31.39 | 15.61 | 25.94 | 5.14 | 30.22 |
| Dickson County | 10 | 6 | 15 | 16 | 16 | 19.95 | 11.89 | 29.22 | 30.82 | 30.27 |
| Dyer County | 7 | 6 | 6 | 11 | 9 | 18.38 | 15.87 | 15.88 | 29.25 | 24.02 |
| Fayette County | 5 | 6 | 3 | 12 | 9 | 12.88 | 15.37 | 7.65 | 30.32 | 22.48 |
| Fentress County | 3 | 4 | 5 | 1 | 8 | 16.75 | 22.42 | 28 | 5.57 | 44.11 |
| Franklin County | 7 | 7 | 9 | 5 | 5 | 17 | 16.96 | 21.78 | 12.03 | 12 |
| Gibson County | 6 | 6 | 5 | 8 | 5 | 12.16 | 12.15 | 10.16 | 16.29 | 10.18 |
| Giles County | 9 | 9 | 11 | 10 | 8 | 31.24 | 31.22 | 38 | 34.32 | 27.21 |
| Grainger County | 3 | 7 | 6 | 6 | 5 | 13.19 | 30.61 | 26.26 | 25.96 | 21.6 |
| Greene County | 15 | 11 | 15 | 22 | 18 | 21.96 | 16.07 | 21.9 | 32.09 | 26.16 |
| Grundy County | 10 | 4 | 0 | 2 | 1 | 74.36 | 29.91 | 0 | 15.06 | 7.48 |
| Hamblen County | 12 | 10 | 6 | 10 | 12 | 19.05 | 15.89 | 9.47 | 15.69 | 18.67 |
| Hamilton County | 43 | 42 | 42 | 39 | 27 | 12.32 | 11.98 | 11.87 | 10.89 | 7.47 |
| Hancock County | 1 | 2 | 0 | 2 | 9 | 15.09 | 30.19 | 0 | 30.32 | 136.36 |
| Hardeman County | 5 | 5 | 2 | 5 | 6 | 19.02 | 19.28 | 7.76 | 19.63 | 23.58 |
| Hardin County | 4 | 10 | 3 | 9 | 8 | 15.43 | 38.77 | 11.65 | 34.94 | 30.95 |
| Hawkins County | 6 | 14 | 9 | 11 | 14 | 10.61 | 24.84 | 16 | 19.52 | 24.8 |
| Haywood County | 13 | 10 | 9 | 3 | 8 | 71.41 | 55.05 | 50.08 | 16.85 | 45.52 |
| Henderson County | 9 | 4 | 9 | 14 | 9 | 32.2 | 14.29 | 32.18 | 50.37 | 32.43 |
| Henry County | 4 | 4 | 9 | 3 | 13 | 12.41 | 12.4 | 28 | 9.3 | 40.06 |
| Hickman County | 8 | 5 | 4 | 5 | 13 | 33.06 | 20.47 | 16.42 | 20.28 | 52.28 |
| Houston County | 5 | 1 | 5 | 1 | 1 | 60.45 | 12.17 | 61.56 | 12.32 | 12.18 |
| Humphreys County | 5 | 4 | 6 | 7 | 8 | 27.4 | 22.04 | 33.07 | 38.08 | 43.28 |
| Jackson County | 2 | 3 | 4 | 2 | 6 | 17.32 | 26.04 | 34.71 | 17.24 | 51.38 |
| Jefferson County | 16 | 11 | 11 | 7 | 8 | 30.71 | 21 | 20.76 | 13.17 | 14.87 |
| Johnson County | 6 | 3 | 4 | 0 | 6 | 33.34 | 16.73 | 22.43 | 0 | 33.92 |
| Knox County | 60 | 56 | 54 | 70 | 57 | 13.51 | 12.5 | 11.96 | 15.35 | 12.34 |
| Lake County | 1 | 0 | 1 | 1 | 1 | 12.99 | 0 | 13.2 | 13.28 | 13.39 |
| Lauderdale County | 5 | 5 | 4 | 6 | 7 | 18.14 | 18.27 | 14.85 | 23.67 | 27.7 |
| Lawrence County | 4 | 5 | 8 | 6 | 6 | 9.54 | 11.85 | 18.85 | 13.96 | 13.83 |
| Lewis County | 0 | 1 | 2 | 1 | 4 | 0 | 8.41 | 16.83 | 8.39 | 33.24 |
| Lincoln County | 8 | 6 | 7 | 9 | 6 | 23.9 | 17.96 | 20.86 | 26.84 | 17.78 |
| Loudon County | 7 | 11 | 6 | 8 | 14 | 13.91 | 21.77 | 11.8 | 15.6 | 26.84 |
| Macon County | 7 | 5 | 4 | 8 | 6 | 30.97 | 21.8 | 17.3 | 34.11 | 24.92 |
| Madison County | 16 | 16 | 18 | 13 | 13 | 16.21 | 16.32 | 18.46 | 13.33 | 13.31 |
| Marion County | 6 | 11 | 5 | 9 | 9 | 21.2 | 38.8 | 17.62 | 31.78 | 31.66 |
| Marshall County | 8 | 1 | 4 | 2 | 1 | 25.75 | 3.2 | 12.68 | 6.26 | 3.04 |
| Maury County | 17 | 19 | 10 | 18 | 19 | 20.35 | 22.26 | 11.44 | 20.09 | 20.62 |
| Mcminn County | 7 | 13 | 11 | 16 | 12 | 13.38 | 24.74 | 20.98 | 30.38 | 22.69 |
| Mcnairy County | 8 | 4 | 10 | 7 | 5 | 30.74 | 15.37 | 38.67 | 27.12 | 19.23 |
| Meigs County | 6 | 5 | 4 | 7 | 4 | 51.5 | 42.74 | 33.94 | 58.59 | 33.15 |
| Monroe County | 11 | 11 | 10 | 9 | 13 | 24.34 | 24.24 | 21.89 | 19.58 | 28.11 |
| Montgomery County | 22 | 28 | 27 | 28 | 30 | 11.95 | 14.82 | 14.02 | 14.37 | 14.99 |
| Moore County | 1 | 2 | 0 | 0 | 2 | 15.92 | 31.76 | 0 | 0 | 31.33 |
| Morgan County | 6 | 2 | 8 | 3 | 6 | 27.7 | 9.22 | 37.23 | 13.81 | 27.73 |
| Obion County | 6 | 6 | 2 | 2 | 4 | 19.35 | 19.47 | 6.54 | 6.55 | 13.16 |
| Overton County | 8 | 6 | 5 | 3 | 4 | 36.41 | 27.34 | 22.66 | 13.65 | 18.17 |
| Perry County | 3 | 5 | 0 | 5 | 4 | 38.08 | 63.95 | 0 | 63.36 | 50.16 |
| Pickett County | 1 | 2 | 0 | 0 | 2 | 19.98 | 39.46 | 0 | 0 | 39.42 |
| Polk County | 5 | 6 | 6 | 2 | 7 | 30.06 | 35.96 | 35.79 | 11.93 | 41.77 |
| Putnam County | 7 | 7 | 5 | 17 | 10 | 9.46 | 9.34 | 6.66 | 22.33 | 12.87 |
| Rhea County | 4 | 3 | 9 | 2 | 6 | 12.32 | 9.22 | 27.85 | 6.17 | 18.35 |
| Roane County | 10 | 11 | 11 | 13 | 14 | 18.83 | 20.82 | 20.85 | 24.57 | 26.4 |
| Robertson County | 13 | 11 | 8 | 16 | 11 | 19.34 | 16.21 | 11.69 | 23.13 | 15.67 |
| Rutherford County | 27 | 35 | 25 | 43 | 39 | 9.61 | 12.13 | 8.39 | 13.98 | 12.3 |
| Scott County | 2 | 3 | 5 | 5 | 10 | 9.09 | 13.65 | 22.85 | 22.84 | 45.48 |
| Sequatchie County | 1 | 2 | 5 | 3 | 3 | 6.88 | 13.67 | 34.17 | 20.35 | 20.36 |
| Sevier County | 13 | 16 | 16 | 15 | 20 | 13.93 | 16.92 | 16.75 | 15.53 | 20.48 |
| Shelby County | 99 | 107 | 120 | 132 | 122 | 10.55 | 11.4 | 12.79 | 14.09 | 13.02 |
| Smith County | 8 | 9 | 8 | 2 | 7 | 42.02 | 47.3 | 41.61 | 10.27 | 35.65 |
| Stewart County | 3 | 4 | 6 | 6 | 1 | 22.56 | 30.26 | 45.46 | 45.54 | 7.49 |
| Sullivan County | 27 | 23 | 15 | 16 | 17 | 17.28 | 14.7 | 9.6 | 10.23 | 10.82 |
| Sumner County | 14 | 15 | 11 | 22 | 10 | 8.3 | 8.71 | 6.28 | 12.28 | 5.45 |
| Tipton County | 13 | 10 | 5 | 6 | 5 | 21.13 | 16.24 | 8.13 | 9.81 | 8.15 |
| Trousdale County | 3 | 2 | 0 | 3 | 1 | 38.46 | 25.02 | 0 | 30.15 | 9.92 |
| Unicoi County | 3 | 5 | 2 | 0 | 2 | 16.63 | 27.93 | 11.25 | 0 | 11.26 |
| Union County | 3 | 5 | 4 | 4 | 4 | 15.74 | 26.33 | 20.88 | 20.8 | 20.57 |
| Van Buren County | 0 | 3 | 1 | 2 | 4 | 0 | 53.07 | 17.57 | 34.99 | 69.66 |
| Warren County | 14 | 6 | 4 | 8 | 17 | 35.12 | 15.02 | 9.95 | 19.8 | 41.82 |
| Washington County | 12 | 8 | 18 | 8 | 10 | 9.57 | 6.36 | 14.28 | 6.29 | 7.82 |
| Wayne County | 4 | 6 | 3 | 2 | 4 | 23.74 | 35.74 | 17.99 | 12 | 24.12 |
| Weakley County | 10 | 3 | 6 | 8 | 2 | 29.29 | 8.83 | 17.73 | 23.83 | 6 |
| White County | 7 | 6 | 7 | 6 | 6 | 26.75 | 22.88 | 26.55 | 22.68 | 22.43 |
| Williamson County | 17 | 16 | 10 | 13 | 25 | 8.54 | 7.8 | 4.73 | 5.94 | 11.05 |
| Wilson County | 20 | 20 | 16 | 23 | 19 | 16.41 | 15.98 | 12.46 | 17.37 | 13.93 |
Traffic Fatalities Rural vs Urban
Most people think traffic fatalities are more likely to occur in urban areas because there is more traffic on the road which means a vehicle is more likely to be involved in a serious car accident.
| Area | 2008 | 2009 | 2010 | 2011 | 2012 | 2013 | 2014 | 2015 | 2016 | 2017 |
|---|---|---|---|---|---|---|---|---|---|---|
| Rural | 603 | 574 | 606 | 542 | 576 | 534 | 454 | 482 | 465 | 500 |
| Urban | 440 | 412 | 426 | 395 | 439 | 461 | 509 | 478 | 568 | 538 |
| Unknown | 0 | 0 | 0 | 0 | 0 | 0 | 0 | 2 | 4 | 2 |
| Total | 1,043 | 986 | 1,032 | 937 | 1,015 | 995 | 963 | 962 | 1,037 | 1,040 |
According to the table above, there were only three years out of the total ten when more fatalities happened in urban areas.
Fatalities by Person Type
Did the fatality rate have anything to do with vehicle or person type? Are some vehicles more likely to be involved in traffic fatalities than others?
| Person Type | 2013 | 2014 | 2015 | 2016 | 2017 | |
|---|---|---|---|---|---|---|
| Occupants | Passenger Car | 425 | 395 | 375 | 418 | 436 |
| Light Truck - Pickup | 149 | 155 | 145 | 137 | 141 | |
| Light Truck - Utility | 114 | 118 | 129 | 146 | 118 | |
| Light Truck - Van | 31 | 30 | 38 | 30 | 37 | |
| Large Truck | 19 | 24 | 21 | 21 | 24 | |
| Bus | 8 | 3 | 0 | 6 | 0 | |
| Other/Unknown Occupants | 17 | 23 | 9 | 20 | 15 | |
| Total Occupants | 763 | 748 | 718 | 779 | 771 | |
| Light Truck - Other | 0 | 0 | 1 | 1 | 0 | |
| Motorcyclists | Total Motorcyclists | 138 | 120 | 123 | 147 | 134 |
| Nonoccupants | Pedestrian | 80 | 86 | 104 | 97 | 124 |
| Bicyclist and Other Cyclist | 8 | 5 | 10 | 9 | 8 | |
| Other/Unknown Nonoccupants | 6 | 4 | 7 | 5 | 3 | |
| Total Nonoccupants | 94 | 95 | 121 | 111 | 135 | |
| Total | Total | 995 | 963 | 962 | 1,037 | 1,040 |
Fatalities by Crash Type
Most of these crashes occurred when there was a roadway departure involved.
| Crash Type | 2013 | 2014 | 2015 | 2016 | 2017 |
|---|---|---|---|---|---|
| Total Fatalities (All Crashes) | 995 | 963 | 962 | 1,037 | 1,040 |
| (1) Single Vehicle | 554 | 555 | 524 | 573 | 585 |
| (2) Involving a Large Truck | 127 | 110 | 116 | 120 | 136 |
| (3) Involving Speeding | 239 | 220 | 189 | 183 | 166 |
| (4) Involving a Rollover | 294 | 271 | 259 | 298 | 261 |
| (5) Involving a Roadway Departure | 624 | 605 | 595 | 652 | 665 |
| (6) Involving an Intersection (or Intersection Related) | 184 | 154 | 164 | 158 | 158 |
Five Year Fatality Trend for the Top Ten Counties in Tennessee
Below is the five-year fatality trend for the top ten counties with the highest fatality rates in Tennessee.
| County | 2013 | 2014 | 2015 | 2016 | 2017 |
|---|---|---|---|---|---|
| Shelby County | 99 | 107 | 120 | 132 | 122 |
| Davidson County | 71 | 64 | 76 | 71 | 75 |
| Knox County | 60 | 56 | 54 | 70 | 57 |
| Rutherford County | 27 | 35 | 25 | 43 | 39 |
| Montgomery County | 22 | 28 | 27 | 28 | 30 |
| Hamilton County | 43 | 42 | 42 | 39 | 27 |
| Williamson County | 17 | 16 | 10 | 13 | 25 |
| Sevier County | 13 | 16 | 16 | 15 | 20 |
| Maury County | 17 | 19 | 10 | 18 | 19 |
| Wilson County | 20 | 20 | 16 | 23 | 19 |
Fatalities Involving Speeding by County
Speeding is another major cause of road fatalities.
| County | Fatalities 2013 | 2014 | 2015 | 2016 | 2017 | Fatalities Per 100K Population 2013 | 2014 | 2015 | 2016 | 2017 |
|---|---|---|---|---|---|---|---|---|---|---|
| Anderson County | 3 | 4 | 2 | 3 | 2 | 3.99 | 5.32 | 2.65 | 3.97 | 2.62 |
| Bedford County | 6 | 2 | 2 | 1 | 0 | 13.16 | 4.32 | 4.27 | 2.11 | 0 |
| Benton County | 2 | 0 | 0 | 1 | 1 | 12.23 | 0 | 0 | 6.23 | 6.26 |
| Bledsoe County | 0 | 0 | 0 | 0 | 2 | 0 | 0 | 0 | 0 | 13.59 |
| Blount County | 7 | 10 | 3 | 3 | 3 | 5.61 | 7.95 | 2.37 | 2.34 | 2.31 |
| Bradley County | 1 | 6 | 6 | 3 | 4 | 0.98 | 5.84 | 5.78 | 2.87 | 3.79 |
| Campbell County | 4 | 1 | 3 | 0 | 0 | 9.95 | 2.51 | 7.56 | 0 | 0 |
| Cannon County | 0 | 0 | 0 | 0 | 1 | 0 | 0 | 0 | 0 | 7.03 |
| Carroll County | 4 | 1 | 0 | 0 | 0 | 13.99 | 3.53 | 0 | 0 | 0 |
| Carter County | 0 | 2 | 2 | 0 | 1 | 0 | 3.55 | 3.55 | 0 | 1.77 |
| Cheatham County | 1 | 3 | 0 | 0 | 1 | 2.54 | 7.57 | 0 | 0 | 2.48 |
| Chester County | 1 | 0 | 1 | 0 | 0 | 5.86 | 0 | 5.85 | 0 | 0 |
| Claiborne County | 1 | 2 | 2 | 2 | 0 | 3.16 | 6.34 | 6.35 | 6.34 | 0 |
| Clay County | 0 | 0 | 0 | 0 | 0 | 0 | 0 | 0 | 0 | 0 |
| Cocke County | 0 | 0 | 2 | 2 | 2 | 0 | 0 | 5.7 | 5.69 | 5.62 |
| Coffee County | 2 | 2 | 1 | 7 | 0 | 3.75 | 3.74 | 1.85 | 12.86 | 0 |
| Crockett County | 0 | 1 | 0 | 0 | 0 | 0 | 6.83 | 0 | 0 | 0 |
| Cumberland County | 2 | 2 | 2 | 3 | 1 | 3.49 | 3.46 | 3.44 | 5.13 | 1.69 |
| Davidson County | 15 | 14 | 20 | 21 | 9 | 2.27 | 2.09 | 2.94 | 3.05 | 1.3 |
| Decatur County | 0 | 2 | 0 | 0 | 3 | 0 | 17.12 | 0 | 0 | 25.53 |
| Dekalb County | 1 | 0 | 1 | 0 | 0 | 5.23 | 0 | 5.19 | 0 | 0 |
| Dickson County | 6 | 2 | 0 | 1 | 0 | 11.97 | 3.96 | 0 | 1.93 | 0 |
| Dyer County | 2 | 0 | 0 | 0 | 3 | 5.25 | 0 | 0 | 0 | 8.01 |
| Fayette County | 0 | 2 | 0 | 1 | 1 | 0 | 5.12 | 0 | 2.53 | 2.5 |
| Fentress County | 0 | 0 | 0 | 0 | 0 | 0 | 0 | 0 | 0 | 0 |
| Franklin County | 4 | 2 | 4 | 1 | 1 | 9.72 | 4.85 | 9.68 | 2.41 | 2.4 |
| Gibson County | 2 | 0 | 0 | 1 | 1 | 4.05 | 0 | 0 | 2.04 | 2.04 |
| Giles County | 1 | 4 | 1 | 2 | 0 | 3.47 | 13.88 | 3.45 | 6.86 | 0 |
| Grainger County | 0 | 2 | 0 | 0 | 0 | 0 | 8.75 | 0 | 0 | 0 |
| Greene County | 7 | 2 | 1 | 4 | 2 | 10.25 | 2.92 | 1.46 | 5.83 | 2.91 |
| Grundy County | 2 | 3 | 0 | 2 | 0 | 14.87 | 22.43 | 0 | 15.06 | 0 |
| Hamblen County | 4 | 3 | 2 | 0 | 2 | 6.35 | 4.77 | 3.16 | 0 | 3.11 |
| Hamilton County | 12 | 12 | 13 | 16 | 7 | 3.44 | 3.42 | 3.67 | 4.47 | 1.94 |
| Hancock County | 0 | 0 | 0 | 1 | 4 | 0 | 0 | 0 | 15.16 | 60.61 |
| Hardeman County | 0 | 1 | 0 | 4 | 1 | 0 | 3.86 | 0 | 15.7 | 3.93 |
| Hardin County | 1 | 2 | 0 | 0 | 0 | 3.86 | 7.75 | 0 | 0 | 0 |
| Hawkins County | 2 | 4 | 1 | 1 | 1 | 3.54 | 7.1 | 1.78 | 1.77 | 1.77 |
| Haywood County | 0 | 3 | 1 | 0 | 1 | 0 | 16.52 | 5.56 | 0 | 5.69 |
| Henderson County | 1 | 1 | 0 | 0 | 0 | 3.58 | 3.57 | 0 | 0 | 0 |
| Henry County | 1 | 1 | 1 | 1 | 1 | 3.1 | 3.1 | 3.11 | 3.1 | 3.08 |
| Hickman County | 2 | 0 | 1 | 0 | 0 | 8.26 | 0 | 4.1 | 0 | 0 |
| Houston County | 2 | 0 | 0 | 0 | 0 | 24.18 | 0 | 0 | 0 | 0 |
| Humphreys County | 1 | 0 | 1 | 0 | 0 | 5.48 | 0 | 5.51 | 0 | 0 |
| Jackson County | 0 | 1 | 0 | 0 | 0 | 0 | 8.68 | 0 | 0 | 0 |
| Jefferson County | 1 | 5 | 2 | 2 | 1 | 1.92 | 9.54 | 3.77 | 3.76 | 1.86 |
| Johnson County | 2 | 1 | 1 | 0 | 2 | 11.11 | 5.58 | 5.61 | 0 | 11.31 |
| Knox County | 9 | 10 | 11 | 20 | 12 | 2.03 | 2.23 | 2.44 | 4.38 | 2.6 |
| Lake County | 0 | 0 | 0 | 1 | 0 | 0 | 0 | 0 | 13.28 | 0 |
| Lauderdale County | 1 | 0 | 0 | 0 | 1 | 3.63 | 0 | 0 | 0 | 3.96 |
| Lawrence County | 2 | 1 | 0 | 0 | 1 | 4.77 | 2.37 | 0 | 0 | 2.3 |
| Lewis County | 0 | 0 | 0 | 0 | 0 | 0 | 0 | 0 | 0 | 0 |
| Lincoln County | 1 | 1 | 0 | 1 | 1 | 2.99 | 2.99 | 0 | 2.98 | 2.96 |
| Loudon County | 3 | 1 | 1 | 0 | 0 | 5.96 | 1.98 | 1.97 | 0 | 0 |
| Macon County | 1 | 1 | 1 | 2 | 0 | 4.42 | 4.36 | 4.33 | 8.53 | 0 |
| Madison County | 4 | 2 | 1 | 2 | 1 | 4.05 | 2.04 | 1.03 | 2.05 | 1.02 |
| Marion County | 2 | 4 | 0 | 1 | 2 | 7.07 | 14.11 | 0 | 3.53 | 7.04 |
| Marshall County | 1 | 0 | 0 | 1 | 0 | 3.22 | 0 | 0 | 3.13 | 0 |
| Maury County | 3 | 3 | 0 | 3 | 1 | 3.59 | 3.52 | 0 | 3.35 | 1.09 |
| Mcminn County | 3 | 6 | 3 | 3 | 3 | 5.73 | 11.42 | 5.72 | 5.7 | 5.67 |
| Mcnairy County | 3 | 0 | 3 | 1 | 0 | 11.53 | 0 | 11.6 | 3.87 | 0 |
| Meigs County | 0 | 2 | 1 | 4 | 0 | 0 | 17.1 | 8.49 | 33.48 | 0 |
| Monroe County | 1 | 2 | 2 | 2 | 0 | 2.21 | 4.41 | 4.38 | 4.35 | 0 |
| Montgomery County | 8 | 7 | 8 | 10 | 9 | 4.35 | 3.7 | 4.15 | 5.13 | 4.5 |
| Moore County | 0 | 0 | 0 | 0 | 0 | 0 | 0 | 0 | 0 | 0 |
| Morgan County | 3 | 0 | 0 | 0 | 2 | 13.85 | 0 | 0 | 0 | 9.24 |
| Obion County | 3 | 0 | 0 | 1 | 0 | 9.67 | 0 | 0 | 3.28 | 0 |
| Overton County | 1 | 0 | 0 | 1 | 0 | 4.55 | 0 | 0 | 4.55 | 0 |
| Perry County | 1 | 2 | 0 | 2 | 0 | 12.69 | 25.58 | 0 | 25.34 | 0 |
| Pickett County | 0 | 1 | 0 | 0 | 0 | 0 | 19.73 | 0 | 0 | 0 |
| Polk County | 3 | 1 | 2 | 0 | 3 | 18.03 | 5.99 | 11.93 | 0 | 17.9 |
| Putnam County | 1 | 1 | 2 | 0 | 2 | 1.35 | 1.33 | 2.66 | 0 | 2.57 |
| Rhea County | 1 | 1 | 2 | 0 | 2 | 3.08 | 3.07 | 6.19 | 0 | 6.12 |
| Roane County | 2 | 1 | 0 | 1 | 4 | 3.77 | 1.89 | 0 | 1.89 | 7.54 |
| Robertson County | 2 | 2 | 2 | 1 | 0 | 2.98 | 2.95 | 2.92 | 1.45 | 0 |
| Rutherford County | 8 | 4 | 6 | 6 | 7 | 2.85 | 1.39 | 2.01 | 1.95 | 2.21 |
| Scott County | 0 | 2 | 0 | 0 | 0 | 0 | 9.1 | 0 | 0 | 0 |
| Sequatchie County | 0 | 0 | 3 | 1 | 2 | 0 | 0 | 20.5 | 6.78 | 13.57 |
| Sevier County | 3 | 5 | 6 | 2 | 3 | 3.22 | 5.29 | 6.28 | 2.07 | 3.07 |
| Shelby County | 21 | 28 | 36 | 21 | 28 | 2.24 | 2.98 | 3.84 | 2.24 | 2.99 |
| Smith County | 1 | 5 | 0 | 0 | 2 | 5.25 | 26.28 | 0 | 0 | 10.19 |
| Stewart County | 1 | 1 | 3 | 0 | 0 | 7.52 | 7.57 | 22.73 | 0 | 0 |
| Sullivan County | 6 | 3 | 3 | 2 | 6 | 3.84 | 1.92 | 1.92 | 1.28 | 3.82 |
| Sumner County | 4 | 0 | 0 | 0 | 4 | 2.37 | 0 | 0 | 0 | 2.18 |
| Tipton County | 1 | 2 | 2 | 0 | 0 | 1.63 | 3.25 | 3.25 | 0 | 0 |
| Trousdale County | 1 | 0 | 0 | 0 | 0 | 12.82 | 0 | 0 | 0 | 0 |
| Unicoi County | 0 | 2 | 1 | 0 | 1 | 0 | 11.17 | 5.62 | 0 | 5.63 |
| Union County | 2 | 2 | 1 | 0 | 1 | 10.5 | 10.53 | 5.22 | 0 | 5.14 |
| Van Buren County | 0 | 1 | 0 | 0 | 0 | 0 | 17.69 | 0 | 0 | 0 |
| Warren County | 7 | 2 | 1 | 2 | 2 | 17.56 | 5.01 | 2.49 | 4.95 | 4.92 |
| Washington County | 5 | 4 | 4 | 3 | 2 | 3.99 | 3.18 | 3.17 | 2.36 | 1.56 |
| Wayne County | 0 | 1 | 0 | 1 | 0 | 0 | 5.96 | 0 | 6 | 0 |
| Weakley County | 0 | 1 | 0 | 2 | 0 | 0 | 2.94 | 0 | 5.96 | 0 |
| White County | 3 | 1 | 2 | 0 | 1 | 11.46 | 3.81 | 7.59 | 0 | 3.74 |
| Williamson County | 3 | 1 | 0 | 1 | 3 | 1.51 | 0.49 | 0 | 0.46 | 1.33 |
| Wilson County | 11 | 3 | 6 | 2 | 2 | 9.02 | 2.4 | 4.67 | 1.51 | 1.47 |
Fatalities in Crashes Involving an Alcohol-Impaired Driver (BAC = .08+) by County
The state of Tennessee has strict rules regarding drinking and driving. There were 251 alcohol-impaired road fatalities in 2017 in the state of Tennessee.
| County | Fatalities 2013 | 2014 | 2015 | 2016 | 2017 | Fatalities Per 100K Population 2013 | 2014 | 2015 | 2016 | 2017 |
|---|---|---|---|---|---|---|---|---|---|---|
| Anderson County | 3 | 6 | 1 | 2 | 3 | 3.99 | 7.99 | 1.33 | 2.65 | 3.93 |
| Bedford County | 10 | 5 | 4 | 1 | 1 | 21.94 | 10.81 | 8.53 | 2.11 | 2.08 |
| Benton County | 5 | 1 | 2 | 1 | 2 | 30.57 | 6.18 | 12.35 | 6.23 | 12.51 |
| Bledsoe County | 0 | 0 | 1 | 0 | 3 | 0 | 0 | 6.9 | 0 | 20.38 |
| Blount County | 5 | 5 | 9 | 4 | 2 | 4 | 3.97 | 7.1 | 3.12 | 1.54 |
| Bradley County | 5 | 2 | 9 | 2 | 4 | 4.91 | 1.95 | 8.67 | 1.92 | 3.79 |
| Campbell County | 2 | 1 | 2 | 0 | 0 | 4.97 | 2.51 | 5.04 | 0 | 0 |
| Cannon County | 0 | 0 | 0 | 0 | 2 | 0 | 0 | 0 | 0 | 14.07 |
| Carroll County | 2 | 2 | 1 | 1 | 0 | 7 | 7.05 | 3.58 | 3.58 | 0 |
| Carter County | 0 | 1 | 2 | 2 | 1 | 0 | 1.78 | 3.55 | 3.54 | 1.77 |
| Cheatham County | 0 | 3 | 2 | 2 | 2 | 0 | 7.57 | 5.05 | 5.03 | 4.96 |
| Chester County | 2 | 0 | 1 | 0 | 0 | 11.71 | 0 | 5.85 | 0 | 0 |
| Claiborne County | 2 | 0 | 1 | 2 | 0 | 6.33 | 0 | 3.17 | 6.34 | 0 |
| Clay County | 0 | 0 | 0 | 1 | 0 | 0 | 0 | 0 | 13.01 | 0 |
| Cocke County | 2 | 2 | 2 | 2 | 2 | 5.66 | 5.68 | 5.7 | 5.69 | 5.62 |
| Coffee County | 0 | 3 | 6 | 5 | 3 | 0 | 5.61 | 11.09 | 9.19 | 5.45 |
| Crockett County | 1 | 1 | 2 | 0 | 0 | 6.85 | 6.83 | 13.72 | 0 | 0 |
| Cumberland County | 3 | 3 | 1 | 2 | 2 | 5.23 | 5.19 | 1.72 | 3.42 | 3.39 |
| Davidson County | 26 | 19 | 28 | 24 | 22 | 3.94 | 2.83 | 4.11 | 3.48 | 3.18 |
| Decatur County | 0 | 2 | 1 | 1 | 2 | 0 | 17.12 | 8.62 | 8.54 | 17.02 |
| Dekalb County | 2 | 0 | 0 | 0 | 1 | 10.46 | 0 | 0 | 0 | 5.04 |
| Dickson County | 3 | 3 | 6 | 2 | 1 | 5.98 | 5.94 | 11.69 | 3.85 | 1.89 |
| Dyer County | 2 | 3 | 2 | 3 | 1 | 5.25 | 7.93 | 5.29 | 7.98 | 2.67 |
| Fayette County | 2 | 2 | 1 | 1 | 3 | 5.15 | 5.12 | 2.55 | 2.53 | 7.49 |
| Fentress County | 1 | 0 | 2 | 1 | 0 | 5.58 | 0 | 11.2 | 5.57 | 0 |
| Franklin County | 3 | 3 | 2 | 0 | 3 | 7.29 | 7.27 | 4.84 | 0 | 7.2 |
| Gibson County | 1 | 1 | 1 | 1 | 0 | 2.03 | 2.03 | 2.03 | 2.04 | 0 |
| Giles County | 2 | 3 | 2 | 2 | 2 | 6.94 | 10.41 | 6.91 | 6.86 | 6.8 |
| Grainger County | 0 | 3 | 0 | 0 | 0 | 0 | 13.12 | 0 | 0 | 0 |
| Greene County | 2 | 3 | 2 | 4 | 3 | 2.93 | 4.38 | 2.92 | 5.83 | 4.36 |
| Grundy County | 1 | 2 | 0 | 0 | 0 | 7.44 | 14.95 | 0 | 0 | 0 |
| Hamblen County | 1 | 3 | 1 | 0 | 2 | 1.59 | 4.77 | 1.58 | 0 | 3.11 |
| Hamilton County | 10 | 13 | 7 | 12 | 7 | 2.87 | 3.71 | 1.98 | 3.35 | 1.94 |
| Hancock County | 0 | 1 | 0 | 0 | 4 | 0 | 15.1 | 0 | 0 | 60.61 |
| Hardeman County | 1 | 1 | 0 | 0 | 0 | 3.8 | 3.86 | 0 | 0 | 0 |
| Hardin County | 0 | 3 | 0 | 3 | 2 | 0 | 11.63 | 0 | 11.65 | 7.74 |
| Hawkins County | 0 | 2 | 1 | 3 | 5 | 0 | 3.55 | 1.78 | 5.32 | 8.86 |
| Haywood County | 3 | 1 | 0 | 2 | 2 | 16.48 | 5.51 | 0 | 11.23 | 11.38 |
| Henderson County | 1 | 2 | 1 | 2 | 0 | 3.58 | 7.15 | 3.58 | 7.2 | 0 |
| Henry County | 2 | 2 | 2 | 1 | 3 | 6.21 | 6.2 | 6.22 | 3.1 | 9.24 |
| Hickman County | 2 | 0 | 1 | 1 | 1 | 8.26 | 0 | 4.1 | 4.06 | 4.02 |
| Houston County | 1 | 0 | 1 | 1 | 0 | 12.09 | 0 | 12.31 | 12.32 | 0 |
| Humphreys County | 0 | 0 | 0 | 1 | 1 | 0 | 0 | 0 | 5.44 | 5.41 |
| Jackson County | 0 | 1 | 0 | 0 | 3 | 0 | 8.68 | 0 | 0 | 25.69 |
| Jefferson County | 6 | 1 | 1 | 1 | 4 | 11.52 | 1.91 | 1.89 | 1.88 | 7.43 |
| Johnson County | 1 | 0 | 2 | 0 | 3 | 5.56 | 0 | 11.21 | 0 | 16.96 |
| Knox County | 16 | 17 | 17 | 13 | 14 | 3.6 | 3.8 | 3.77 | 2.85 | 3.03 |
| Lake County | 1 | 0 | 0 | 1 | 0 | 12.99 | 0 | 0 | 13.28 | 0 |
| Lauderdale County | 1 | 0 | 0 | 0 | 5 | 3.63 | 0 | 0 | 0 | 19.78 |
| Lawrence County | 0 | 1 | 0 | 0 | 0 | 0 | 2.37 | 0 | 0 | 0 |
| Lewis County | 0 | 0 | 0 | 0 | 2 | 0 | 0 | 0 | 0 | 16.62 |
| Lincoln County | 2 | 1 | 1 | 2 | 1 | 5.97 | 2.99 | 2.98 | 5.97 | 2.96 |
| Loudon County | 4 | 2 | 2 | 3 | 0 | 7.95 | 3.96 | 3.93 | 5.85 | 0 |
| Macon County | 0 | 1 | 0 | 2 | 1 | 0 | 4.36 | 0 | 8.53 | 4.15 |
| Madison County | 7 | 4 | 7 | 3 | 5 | 7.09 | 4.08 | 7.18 | 3.08 | 5.12 |
| Marion County | 4 | 2 | 1 | 2 | 0 | 14.13 | 7.05 | 3.52 | 7.06 | 0 |
| Marshall County | 0 | 1 | 1 | 2 | 0 | 0 | 3.2 | 3.17 | 6.26 | 0 |
| Maury County | 7 | 3 | 1 | 3 | 2 | 8.38 | 3.52 | 1.14 | 3.35 | 2.17 |
| Mcminn County | 0 | 6 | 5 | 1 | 2 | 0 | 11.42 | 9.53 | 1.9 | 3.78 |
| Mcnairy County | 1 | 1 | 1 | 2 | 0 | 3.84 | 3.84 | 3.87 | 7.75 | 0 |
| Meigs County | 1 | 2 | 0 | 1 | 1 | 8.58 | 17.1 | 0 | 8.37 | 8.29 |
| Monroe County | 3 | 4 | 4 | 2 | 1 | 6.64 | 8.81 | 8.75 | 4.35 | 2.16 |
| Montgomery County | 4 | 8 | 8 | 10 | 7 | 2.17 | 4.23 | 4.15 | 5.13 | 3.5 |
| Moore County | 0 | 1 | 0 | 0 | 1 | 0 | 15.88 | 0 | 0 | 15.66 |
| Morgan County | 2 | 0 | 0 | 1 | 2 | 9.23 | 0 | 0 | 4.6 | 9.24 |
| Obion County | 0 | 0 | 0 | 0 | 1 | 0 | 0 | 0 | 0 | 3.29 |
| Overton County | 1 | 0 | 0 | 1 | 0 | 4.55 | 0 | 0 | 4.55 | 0 |
| Perry County | 1 | 1 | 0 | 1 | 2 | 12.69 | 12.79 | 0 | 12.67 | 25.08 |
| Pickett County | 1 | 1 | 0 | 0 | 1 | 19.98 | 19.73 | 0 | 0 | 19.71 |
| Polk County | 1 | 6 | 2 | 0 | 1 | 6.01 | 35.96 | 11.93 | 0 | 5.97 |
| Putnam County | 1 | 0 | 3 | 5 | 1 | 1.35 | 0 | 3.99 | 6.57 | 1.29 |
| Rhea County | 0 | 0 | 2 | 0 | 2 | 0 | 0 | 6.19 | 0 | 6.12 |
| Roane County | 5 | 2 | 0 | 1 | 5 | 9.42 | 3.79 | 0 | 1.89 | 9.43 |
| Robertson County | 6 | 6 | 1 | 4 | 3 | 8.93 | 8.84 | 1.46 | 5.78 | 4.27 |
| Rutherford County | 4 | 8 | 4 | 9 | 9 | 1.42 | 2.77 | 1.34 | 2.93 | 2.84 |
| Scott County | 1 | 1 | 0 | 2 | 4 | 4.55 | 4.55 | 0 | 9.14 | 18.19 |
| Sequatchie County | 1 | 1 | 2 | 0 | 0 | 6.88 | 6.83 | 13.67 | 0 | 0 |
| Sevier County | 5 | 7 | 3 | 2 | 5 | 5.36 | 7.4 | 3.14 | 2.07 | 5.12 |
| Shelby County | 38 | 29 | 39 | 35 | 40 | 4.05 | 3.09 | 4.16 | 3.73 | 4.27 |
| Smith County | 2 | 4 | 2 | 0 | 1 | 10.5 | 21.02 | 10.4 | 0 | 5.09 |
| Stewart County | 1 | 2 | 3 | 1 | 0 | 7.52 | 15.13 | 22.73 | 7.59 | 0 |
| Sullivan County | 5 | 8 | 3 | 4 | 2 | 3.2 | 5.11 | 1.92 | 2.56 | 1.27 |
| Sumner County | 4 | 6 | 2 | 2 | 2 | 2.37 | 3.48 | 1.14 | 1.12 | 1.09 |
| Tipton County | 5 | 1 | 2 | 0 | 2 | 8.13 | 1.62 | 3.25 | 0 | 3.26 |
| Trousdale County | 1 | 1 | 0 | 1 | 0 | 12.82 | 12.51 | 0 | 10.05 | 0 |
| Unicoi County | 1 | 2 | 2 | 0 | 2 | 5.54 | 11.17 | 11.25 | 0 | 11.26 |
| Union County | 0 | 1 | 3 | 1 | 0 | 0 | 5.27 | 15.66 | 5.2 | 0 |
| Van Buren County | 0 | 1 | 0 | 0 | 1 | 0 | 17.69 | 0 | 0 | 17.42 |
| Warren County | 6 | 1 | 1 | 0 | 6 | 15.05 | 2.5 | 2.49 | 0 | 14.76 |
| Washington County | 4 | 1 | 6 | 1 | 3 | 3.19 | 0.8 | 4.76 | 0.79 | 2.35 |
| Wayne County | 1 | 4 | 1 | 1 | 0 | 5.93 | 23.83 | 6 | 6 | 0 |
| Weakley County | 4 | 1 | 1 | 0 | 0 | 11.72 | 2.94 | 2.95 | 0 | 0 |
| White County | 3 | 3 | 2 | 0 | 1 | 11.46 | 11.44 | 7.59 | 0 | 3.74 |
| Williamson County | 6 | 5 | 1 | 3 | 6 | 3.02 | 2.44 | 0.47 | 1.37 | 2.65 |
| Wilson County | 8 | 6 | 7 | 6 | 3 | 6.56 | 4.79 | 5.45 | 4.53 | 2.2 |
Teen Drinking and Driving
If you give an inexperienced teenage driver a couple of alcoholic beverages and then ask him or her to get in a car and drive somewhere, you’re looking at a bad situation.
In 26 states and D.C., under-21 alcohol-impaired driving fatalities per 100k population were at or below the national average of 1.2 deaths per 100k population. Thankfully, Tennessee is one of those 26 states with an average of .6 deaths per 100k population.
| DUI Arrest (Under 18 years old) | DUI Arrests (Under 18 years old) Total Per Million People | Rank |
|---|---|---|
| 143 | 95.22 | 21 |
Tennessee ranks 21st in the U.S. for under-18 DUI arrests.
EMS Response Time in Tennessee
Seconds can literally mean all the difference in the world when it comes to EMS response time. Showing up seconds too late could mean losing a victim that could have been saved if an EMS team had shown up earlier.
| Area | Time of Crash to EMS Notification | EMS Notification to EMS Arrival | EMS Arrival at Scene to Hospital Arrival | Time of Crash to Hospital Arrival | Total Fatal Crashes |
|---|---|---|---|---|---|
| Rural | 8.96 mins | 12.65 mins | 50.09 mins | 61.68 mins | 455 |
| Urban | 4.09 mins | 8.21 mins | 33.65 mins | 43.12 mins | 502 |
EMS response times are often faster in cities than they are in rural areas because there are usually more EMS services in cities than there are in the country.
Transportation
Ever wondered how many vehicles your neighbors own? Up next we want to talk about vehicle transportation statistics.
Car Ownership
The following chart from Data USA displays the households in Tennessee distributed between a series of car ownership buckets compared to the national averages for each bucket.
The largest share of households in Tennessee have two cars, followed by three cars.
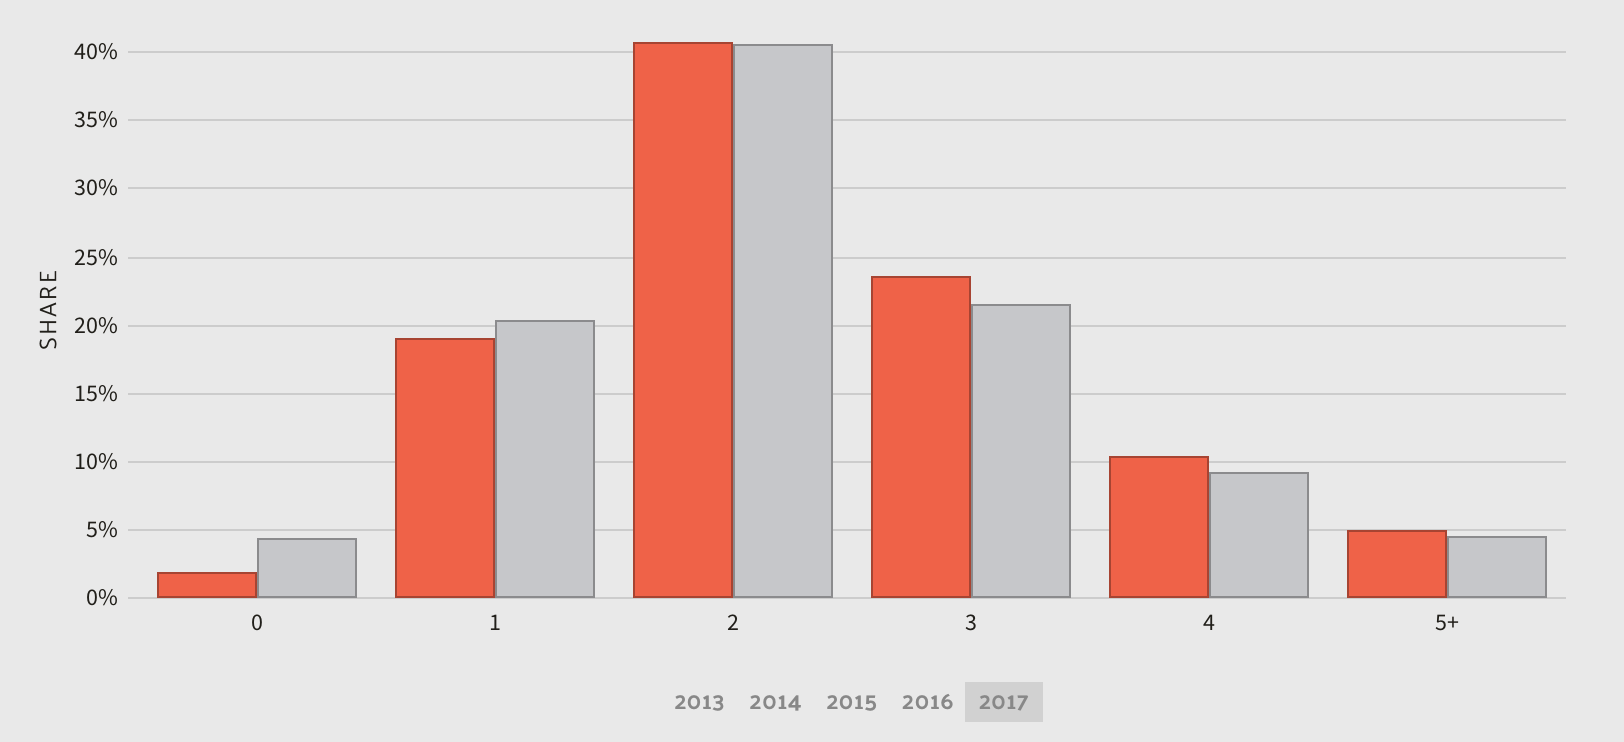
The orange bars represent Tennessee’s average and the gray bars show the national average.
Commute Time
Using averages, employees in Tennessee have a shorter commute time (23.9 minutes) than the normal US worker (25.5 minutes). Additionally, 2.04 percent of the workforce in Tennessee have “super commutes” in excess of 90 minutes.
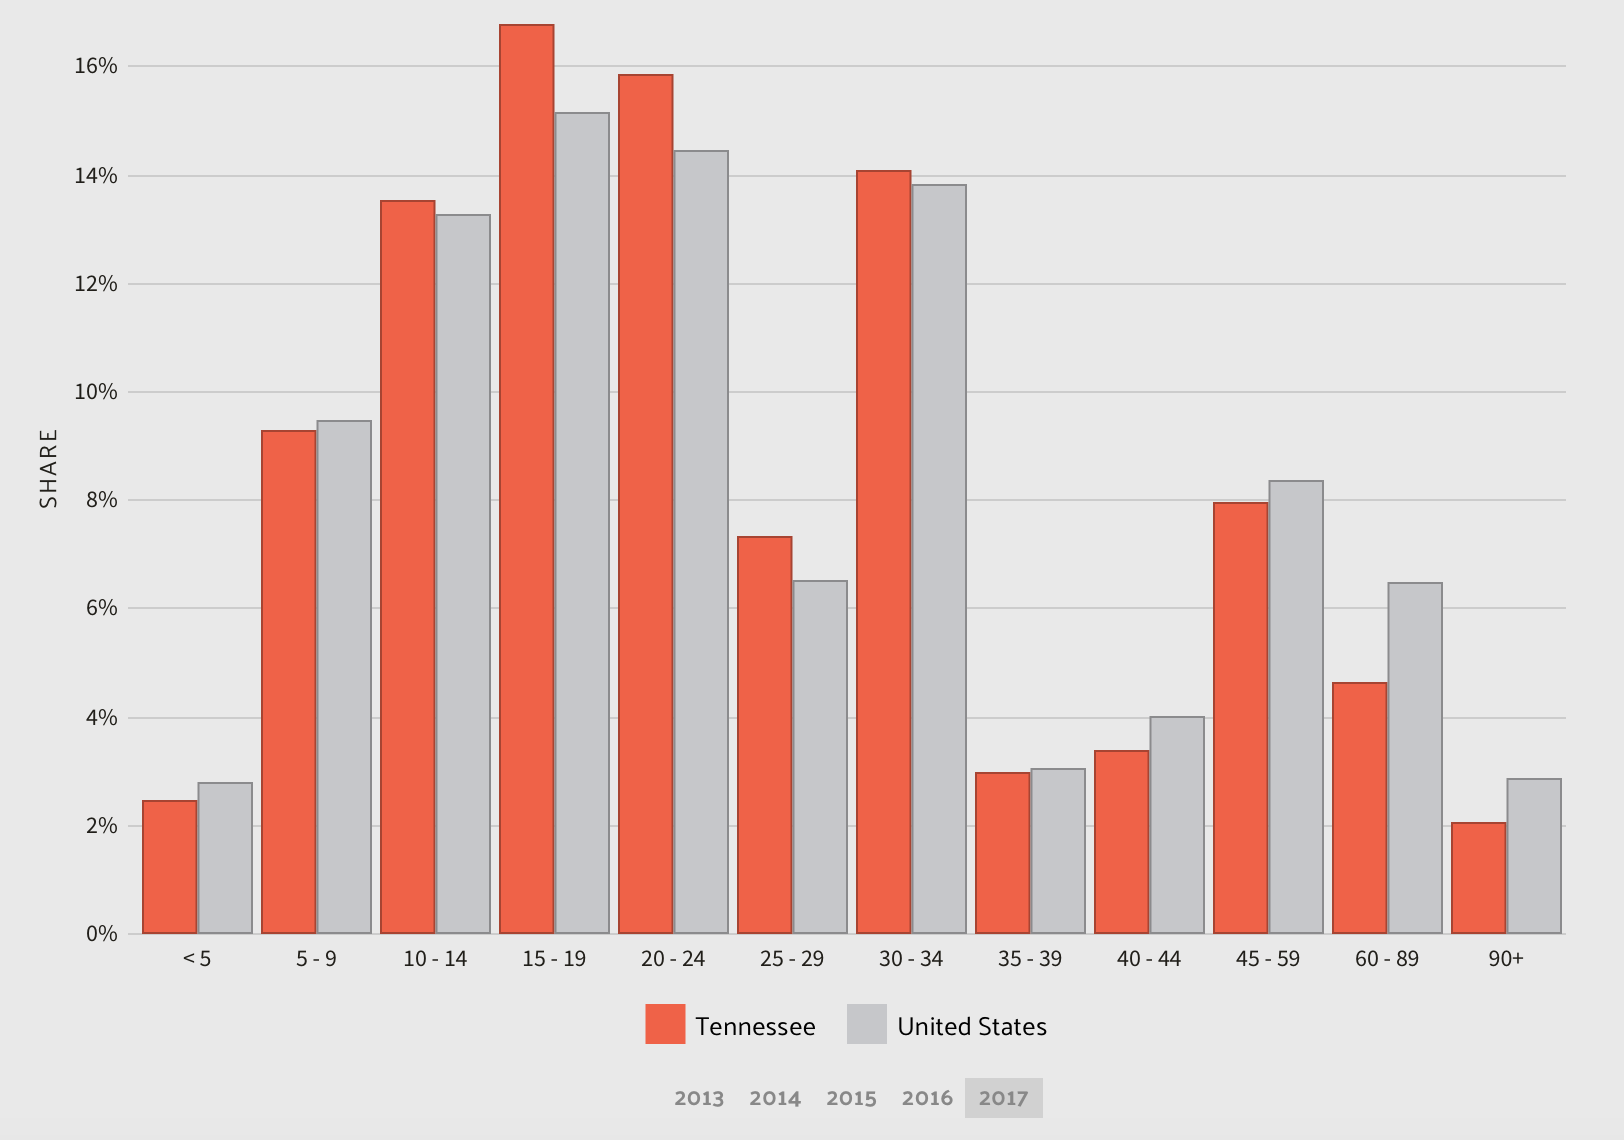
Commuter Transportation
In 2017, the most common method of travel for workers in Tennessee was Drove Alone, followed by those who Carpooled and those who Worked At Home.
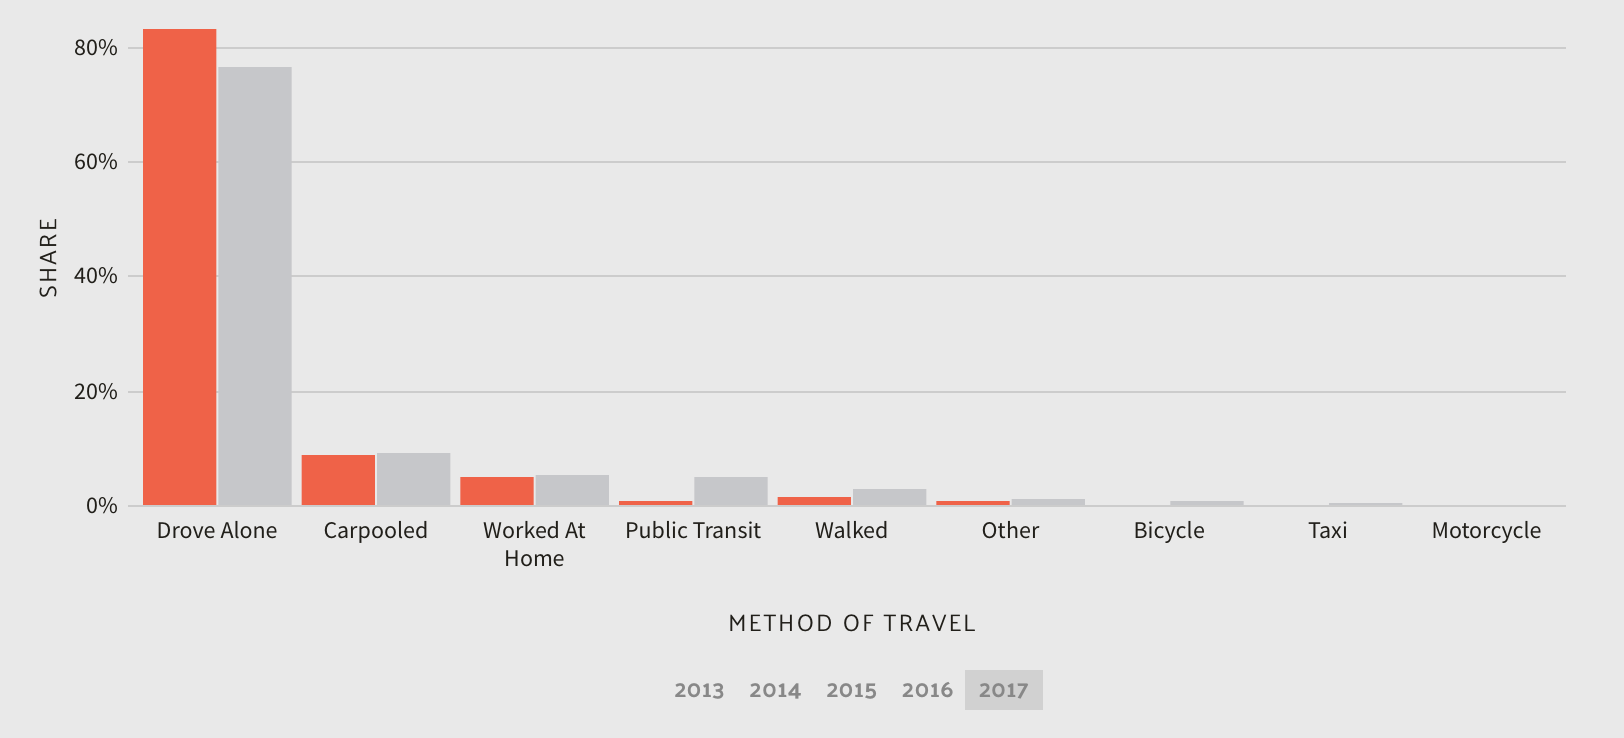
Traffic Congestion in Tennessee
According to Inrix, Tennessee has two of the most traffic-congested cities in the world. Check out the details in the table below.
| City | 2018 World Rank | Hours Lost in Congestion | Cost of Congestion (per driver) | Inner City Travel Time (minutes) |
|---|---|---|---|---|
| Nashville | 114 | 87 | $1,221 | 4 |
| Memphis | 211 | 38 | $530 | 3 |
Now that you’ve read through our complete guide to Tennessee car insurance, it’s time to start shopping for your own car insurance policy. Enter your zip in the box below to get started.
Happy shopping!