Cheap Auto Insurance in Missouri for 2026 (Top 10 Companies for Savings)
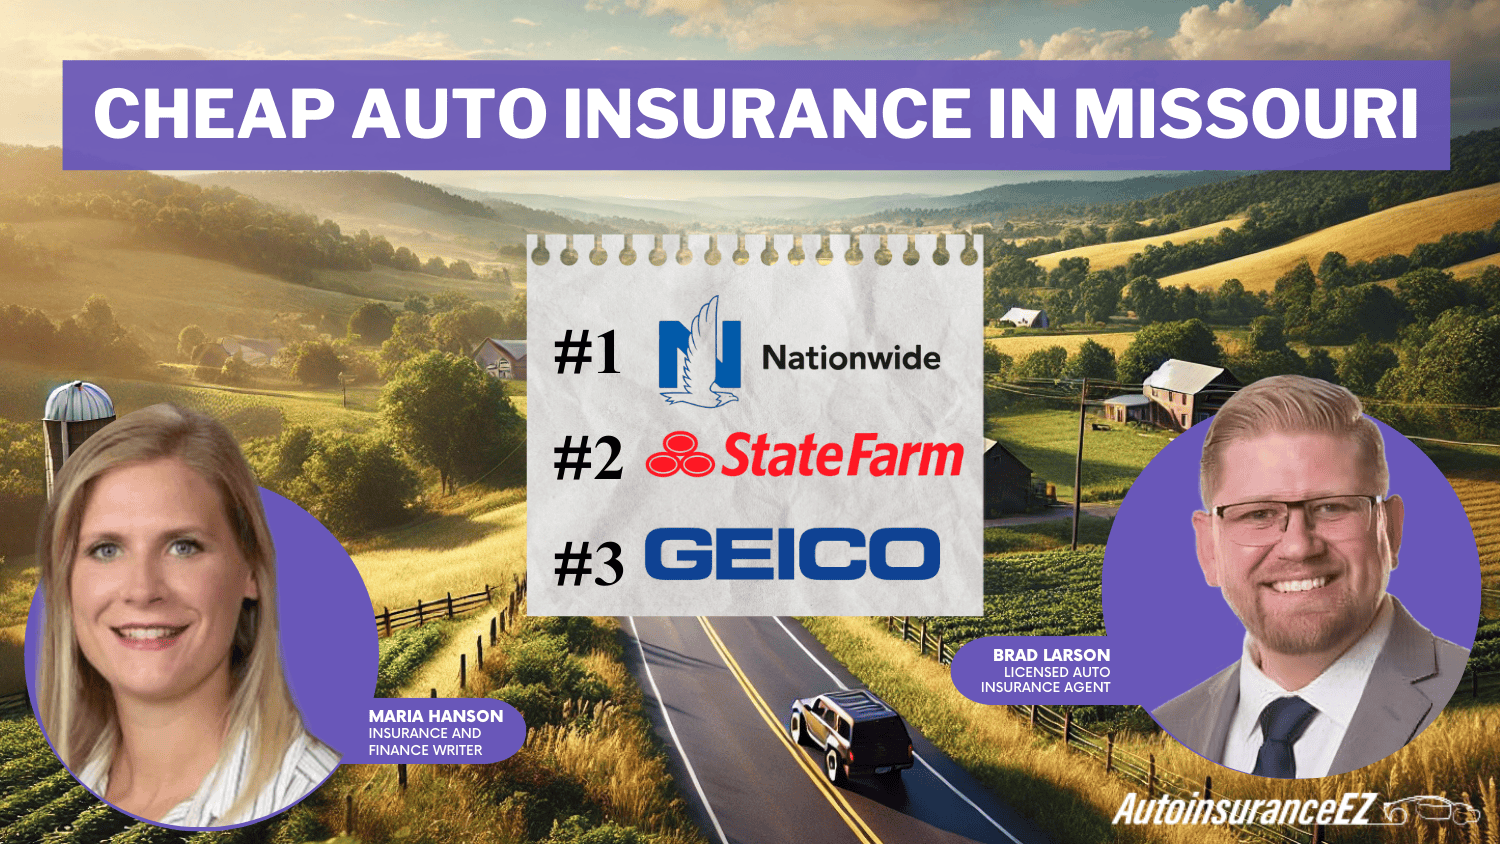
Nationwide, State Farm, and Geico offer cheap auto insurance in Missouri. Nationwide has the most affordable MO car insurance rates, at just $23 per month. These providers are known for their low insurance rates in MO, exceptional claims satisfaction, and reliable coverage for all types of drivers.
Read more


Table of Contents
Table of Contents
Updated March 2025
 3,071 reviews
Company Facts
Minimum Coverage in Missouri
A.M. Best Rating
Complaint Level
Pros & Cons
3,071 reviews 18,157 reviews
Company Facts
Minimum Coverage in Missouri
A.M. Best Rating
Complaint Level
Pros & Cons
18,157 reviews 19,116 reviews
Company Facts
Minimum Coverage in Missouri
A.M. Best Rating
Complaint Level
Pros & Cons
19,116 reviewsNationwide, State Farm and Geico offer cheap auto insurance in Missouri. Nationwide offers the lowest rates at just $23 per month.

These top insurers deliver affordability, reliable coverage, and strong customer satisfaction. Whether you need basic protection or full coverage car insurance, they offer competitive plans to fit your budget.
Our Top 10 Company Picks: Cheap Auto Insurance in Missouri
| Company | Rank | Monthly Rates | A.M. Best | Best For | Jump to Pros/Cons |
|---|---|---|---|---|---|
| #1 | $23 | A+ | Claims Handling | Nationwide | |
| #2 | $30 | B | Personalized Service | State Farm | |
| #3 | $32 | A++ | Online Tools | Geico | |
| #4 | $35 | A+ | Snapshot Program | Progressive | |
| #5 | $37 | A | Customer Service | American Family | |
| #6 | $40 | A++ | Rural Drivers | Travelers | |
| #7 | $45 | A | High-Risk Drivers | The General | |
| #8 | $46 | A | Multi-Policy Discounts | Liberty Mutual | |
| #9 | $48 | A | Bundling Policies | Farmers | |
| #10 | $52 | A+ | Accident Forgiveness | Allstate |
Compare rates to find the best deal and keep your costs below the average Missouri car insurance costs. Explore your car insurance options by entering your ZIP code and finding which companies have the lowest rates.
#1 – Nationwide: Top Overall Pick

Pros
- Low Monthly Premiums: Nationwide offers affordable car insurance in Missouri for $23 a month, an excellent choice for drivers seeking low-cost coverage.
- Responsive Claims Service: Drivers rely on Nationwide’s claims service for being responsive and helpful when they need it most, as well as peace of mind during times of accident.
- Distinguished Financial Strength: Supported by an A+ A.M. Best rating, it guarantees Missouri policyholders their claims will be paid promptly.
Cons
- Fewer Options for Savings: According to the Nationwide auto insurance review, drivers may find fewer discount opportunities, limiting potential savings despite low monthly premiums.
- Basic Online Features: Nationwide’s online tools are functional but lack innovation compared to competitors, which can frustrate tech-savvy Missouri drivers managing policies or claims online.
#2 – State Farm: Best for Personalized Service

Pros
- Personalized Service: State Farm’s large statewide network of agents ensures Missouri drivers a high degree of personalized service, with attention to their unique needs and coverage.
- Low-Cost Premiums: State Farm provides low-cost auto insurance that Missouri motorists can use to pay for their automobiles. For a $30-per-month premium, you can enjoy dependable coverage at a price that is within reach for most budgets.
- Personalized Choices: Flexible coverage choices allow Missouri drivers to tailor their State Farm coverage to provide only the coverage they require.
Cons
- Lower Financial Rating: In our State Farm auto insurance review, the company’s B rating with A.M. Best concerns Missouri drivers prioritizing financial stability when paying claims.
- Limited Digital Features: State Farm’s digital tools lag behind competitors, which could disadvantage Missouri drivers who prefer to manage their policies conveniently online.
#3 – Geico: Best for Online Tools

Pros
- Convenient Online Features: Geico’s website is very easy to use, providing Missouri drivers with easy-to-use tools and hassle-free claims submission.
- High Financial Rating: Geico has an A++ financial rating, providing Missouri drivers with good stability and ensuring timely and secure claims payment for policyholders.
- Low Rates: Geico’s affordable car insurance in Missouri is available for just $32 per month, a perfect solution for frugal drivers.
Cons
- Limited Local Agent Support: In the Geico auto insurance review, Missouri motorists who want personalized assistance might find Geico’s local agent support limited in certain locations.
- High Rates for Inexperienced Drivers: While Geico offers competitive rates for experienced drivers, young or inexperienced Missouri drivers may face significantly higher premiums.
#4 – Progressive: Best for Snapshot Program

Pros
- Snapshot Program Savings: Progressive’s Snapshot gives safe drivers a discount to save on car insurance in Missouri by encouraging good driving behavior.
- Aggressive Claims Process: Progressive is renowned for its streamlined claims process, which allows Missouri motorists to get their settlements quickly and get back on the road sooner after accidents.
- Full Coverage Options: Missouri motorists are attracted to Progressive’s comprehensive selection of full coverage options, including gap insurance and rental car payment reimbursement.
Cons
- Usage-Based Pricing: As we noted in our Progressive auto insurance review, Snapshot monitoring is invasive for some Missouri drivers, particularly if they like less privacy.
- Above Average Rates for High-Risk Drivers: Progressive’s high-risk Missouri driver rates tend to be higher than those of other companies, which might discourage those with bad driving histories.
#5 – American Family: Best for Customer Service

Pros
- Outstanding Customer Service: American Family is committed to Missouri motorists that they will provide individualized and reliable support with claims.
- More Discount Options: American Family offers discounts, such as bundling and excellent student savings, to help Missouri drivers save on car insurance rates and charges.
- Personalized Coverage: Missouri drivers have the option to personalize their American Family policies so that they pay only for the coverage they need and not for extras they do not.
Cons
- Higher Premiums: According to the American Family auto insurance review, the company’s $37 monthly premium is higher than some competitors, which may deter budget-conscious drivers.
- Limited Availability of Discounts: Some Missouri drivers may not qualify for American Family’s specialized discounts, reducing the overall potential for significant savings.
#6 – Travelers: Best for Rural Drivers

Pros
- Excellent for Rural Drivers: Travelers excel at serving rural Missouri drivers with policies that address different coverage needs.
- Outstanding Financial Strength: With an A++ A.M. Best rating, Travelers guarantees Missouri drivers that they can count on timely payment of claims, even in unexpected situations.
- Multi-Car Discounts: Missouri drivers can save a lot of money by purchasing multiple-vehicle insurance under the Travelers policy, which makes it an affordable option for families.
Cons
- Limited Local Presence: Based on our Travelers auto insurance review, the company’s limited local agent pool can be a hassle for Missouri motorists who like to have face-to-face service.
- Above-Average Rates: With a $40 monthly premium, Travelers may not appeal to budget-conscious drivers seeking affordable Missouri car insurance options.
#7 – The General: Best for High-Risk Drivers

Pros
- Perfect for High-Risk Drivers: The General is renowned for offering cheap coverage options specifically designed to address drivers who have a history of high-risk accidents.
- Payment Plans: The General provides Missouri motorists with several flexible payment options, which facilitate easier management of premiums during the policy term.
- No-Fuss Online Services: Missouri drivers can leverage The General’s easy-to-use online services for instant quotes, policy management, and claims payments without unnecessary inconvenience.
Cons
- Higher Average Premiums: Missouri state average monthly premiums are $45, higher than average car insurance rates in Missouri, based on The General auto insurance review.
- Limited Discounts: The General’s discount offerings are limited, reducing its appeal to Missouri drivers seeking significant savings through bundling or other specialized discount options.
#8 – Liberty Mutual: Best for Multi-Policy Discounts

Pros
- Multi-Policy Discounts: Liberty Mutual offers great saving opportunities for Missouri motorists insuring home and automobile policies, providing substantial cost savings.
- Strong Financial Strength: An A rating guarantees Missouri motorists that Liberty Mutual is financially solid and capable of settling claims promptly, even in stressful circumstances.
- Unique Coverage Add-Ons: Extras like accident forgiveness and better car replacement make Liberty Mutual appealing for Missouri drivers seeking more than basic coverage options.
Cons
- Higher Premiums: According to the Liberty Mutual auto insurance review, the average car insurance cost in Missouri is higher, with drivers paying around $46 per month.
- Average Customer Support: Missouri drivers give Liberty Mutual’s customer service mixed reviews, reporting varying experiences with claims and policy management.
#9 – Farmers: Best for Bundling Policies

Pros
- Great Bundling Discounts: Farmers Missouri rewards drivers with discounts for bundling car and homeowners insurance, and it is a great option for those seeking to bundle their coverage.
- Local Agent Network: Farmers extensive agent network provides MO drivers with a neighborhood presence, making them at ease with their coverage and claim settlement.
- Specialized Coverage Features: Farmers offers add-ons like rideshare coverage and new car replacements to Missouri drivers who require specialized coverage.
Cons
- High Monthly Premium: As noted in the Farmers auto insurance review, the firm’s $48 monthly premium is higher and less ideal for those looking for cheap Missouri auto insurance.
- Limited Online Tools: Farmers’ digital platform lacks advanced features, making it less convenient for Missouri drivers who prefer managing their policies online.
#10 – Allstate: Best for Accident Forgiveness

Pros
- Accident Forgiveness: Missouri drivers can avoid having their initial accident with Allstate lead to a premium hike with Allstate’s accident forgiveness feature, giving them peace of mind after unexpected accidents.
- Broad Discounts: Allstate provides Missouri drivers with a broad spectrum of discounts, from safe driver discounts to good student discounts, and policy bundling.
- Comprehensive Mobile App: Allstate’s innovative mobile app enables Missouri drivers to efficiently handle policies, submit claims, and enjoy beneficial features for a seamless overall experience.
Cons
- Higher Premiums: Emphasized in the Allstate auto insurance review, Missouri drivers pay $52 each month, which is the highest among top providers in the state.
- Mixed Claims Reviews: Some report slower claims processing, which is a drawback if you’re seeking the cheapest car insurance in Missouri with faster service.
Missouri Car Insurance Premiums and Coverage
Missouri drivers have several options when purchasing insurance. The minimum coverage with Nationwide is $23, but State Farm and Geico offer full coverage for $85 and $90, respectively. The average cost of car insurance in Missouri is different by coverage and by personal situation.
Missouri Auto Insurance Monthly Rates by Provider & Coverage Level
| Insurance Company | Minimum Coverage | Full Coverage |
|---|---|---|
| $52 | $148 | |
| $37 | $106 | |
| $48 | $135 | |
| $32 | $90 | |
| $46 | $129 | |
| $23 | $66 | |
| $35 | $98 | |
| $30 | $85 | |
| $45 | $120 | |
| $40 | $114 |
High-risk drivers involved in accidents or those who receive tickets tend to pay more and need special policies. Although expensive, these policies provide legal compliance and essential protection for drivers who need it most in Missouri.

Companies such as Farmers and Allstate help drivers obtain affordable, balanced coverage. Shopping around can help both regular and high-risk drivers get the best value for their automobile insurance requirements.
Driving in Missouri Accident and Claims
According to city accident and claim records, driving in Missouri is risky. The majority of accidents—12,500—occur in St. Louis, whereas Kansas City sees 9,800 incidents. Accidents are less common in smaller places like St. Charles.
Missouri Accidents & Claims per Year by City
| City | Accidents per Year | Claims per Year |
|---|---|---|
| Columbia | 3,200 | 2,800 |
| Independence | 4,100 | 3,700 |
| Jefferson City | 1,500 | 1,300 |
| Kansas City | 9,800 | 8,900 |
| Springfield | 5,600 | 5,100 |
| St. Charles | 2,900 | 2,600 |
| St. Louis | 12,500 | 11,400 |
Having the minimum car insurance requirements is important to safeguard yourself, particularly in cities with heavy traffic. These statistics highlight how educated decisions prevent accidents and provide proper coverage.
Missouri insurance claims show the risks that drivers face. Collision claims account for 35% of total claims and cost $4,200, while comprehensive claims at 25% average $2,800 per claim in the state.
5 Common Auto Insurance Claims in Missouri
| Claim Type | Portion of Claims | Cost per Claim |
|---|---|---|
| Collision | 35% | $4,200 |
| Comprehensive | 25% | $2,800 |
| Bodily Injury | 18% | $15,600 |
| Property Damage | 12% | $3,100 |
| Personal Injury | 10% | $9,500 |
Drivers looking for cheap Missouri car insurance need to factor these risks into their decision on coverage. Balancing cost and protection ensures you’re prepared for financial and personal impacts from unexpected accidents.
The Best Discounts From Missouri Car Insurance Companies
Missouri drivers can save big with various discounts offered by top insurers. Allstate provides perks like the safe driver discount, while Geico offers savings for military members and new vehicle owners.
Auto Insurance Discounts From the Top Providers in Missouri
| Insurance Company | Available Discounts |
|---|---|
| Early Signing Discount, Deductible Rewards, Safe Driving Club Discount, Multi-Policy Discount | |
| Steer into Savings Discount, Teen Safe Driver Discount, Loyalty Discount, Defensive Driving Discount | |
| Homeowner Discount, Good Student Discount, Signal by Farmers Discount, Bundling Discount | |
| Military Discount, Good Driver Discount, Multi-Policy Discount, New Vehicle Discount | |
| New Graduate Discount, RightTrack Discount, Paperless Billing Discount, Anti-Theft Discount | |
| SmartRide Discount, Accident-Free Discount, Family Plan Discount, Multi-Policy Discount | |
| Multi-Policy Discount, Homeowner Discount, Continuous Insurance Discount, Snapshot Program Discount | |
| Safe Driver Discount, Multi-Car Discount, Defensive Driving Course Discount, Good Student Discount | |
| Double Deductible Discount, Low-Mileage Discount, Multi-Car Discount, Paid-in-Full Discount | |
| IntelliDrive Program Discount, Multi-Policy Discount, Continuous Insurance Discount, Good Payer Discount |
Farmers reward good students and homeowners, and the American Family supports teen drivers and loyal customers. Companies like Progressive and Liberty Mutual add bundling and anti-theft savings to help drivers reduce costs.
State Farm and The General provide affordable options for those seeking cheap Missouri car insurance companies. Their low-mileage, multi-car, and pay-in-full discounts ensure both cost savings and practical coverage.
Missouri Report Card: Auto Insurance Discounts
| Discount Name | Grade | Savings | Participating Providers |
|---|---|---|---|
| Safe Driver | A | 30% | State Farm, Geico, Allstate, Progressive |
| Multi-Policy | A- | 25% | Farmers, Liberty Mutual, Nationwide |
| Good Student | B+ | 20% | American Family, USAA, State Farm |
| Anti-Theft Device | B | 15% | Travelers, Progressive, Allstate |
| Low Mileage | B- | 10% | Geico, Nationwide, Farmers |
Comparing discounts like good student incentives, multi-policy savings, and safe driver programs is essential. Finding a supplier who satisfies your needs can maximize savings and offer you comfort.
Insurance Core Coverage and Premiums in Missouri
Missouri has a great deal of car insurance options, with various costs depending on coverage. The average annual cost for liability was $415.88, and comprehensive was $181.27. Prices today are likely to be higher.
Missouri Auto Insurance Monthly Rates by Coverage Type
| Coverage Type | Monthly Rates |
|---|---|
| Liability | $70 |
| Collision | $110 |
| Comprehensive | $90 |
| Full Coverage | $180 |
Liability insurance is legally required in the state, but additional coverage like collision and comprehensive provides better protection. For cheap liability car insurance in Missouri, comparing quotes is essential.
Missouri’s insurance market is competitive, with many discounts to help drivers save. Knowing how to lower your auto insurance premiums, like raising deductibles or bundling, is key to cutting costs.
Missouri Report Card: Auto Insurance Premiums
| Category | Grade | Explanation |
|---|---|---|
| Availability | A | Many insurers, competitive rates. |
| Discounts & Savings Options | A- | Good discounts available. |
| Affordability | B | Moderate premiums vs. national avg. |
| Consumer Satisfaction | B- | Mixed reviews on claims. |
| Rate Stability | C+ | Premiums fluctuate. |
While affordability remains moderate, premiums hover slightly above the national average. Consumer satisfaction and rate stability still need improvement, but Missouri drivers can find the right coverage.
Finding Affordable Insurance Options Across Missouri Cities
Finding affordable insurance in MO doesn’t have to be complicated. Whether you live in Columbia, Independence, Kansas City, or Springfield, this guide outlines five steps to help you secure the best rates and coverage.

Here are five steps to follow to investigate your insurance options and make sure you have the proper coverage for your needs.
- Evaluate Your Coverage Needs: Decide if you need basic liability or additional protection, such as comprehensive and collision coverage, to cover accidents, theft, or weather damage.
- Compare Rates Online: Use comparison tools to find providers offering cheap auto insurance in Columbia, MO, or other cities in Missouri. Focus on plans that meet your coverage requirements.
- Check Provider Reputation: Assess customer testimonials to see if the insurer has an efficient claims mechanism and satisfactory service.
- Ask about Discounts: Seek discounts offered for safe driving, multi-policies, or good credit.
- Opt for a City-Targeted Plan: Plans from Columbia, Independence, Kansas City, and Springfield providers typically cater to inhabitants of those regions. Pick one that has the best value.
Here are the procedures to protect your funds and obtain cheap coverage. Missouri offers a wide range of options, so you may find a plan that meets your needs and budget. To guarantee the best prices, compare now.
Missouri Auto Insurance Minimum Coverage
Missouri has fault vs. no-fault auto insurance laws, so the driver at fault in the accident must pay for the loss. In no-fault states, a person files a claim with his own insurance provider. Liability insurance is legally required to be allowed to drive in Missouri.
Missouri drivers must carry at least $25,000 for injuries per person, $50,000 per accident, and $10,000 for property damage. Liability coverage only pays for damages caused to others—it won’t cover the at-fault driver’s own vehicle repairs or medical expenses.
Nationwide stands out in Missouri with strong coverage, accident forgiveness, and vanishing deductibles—valuable perks to help drivers avoid unexpected premium hikes.
Chris Abrams Licensed Insurance Agent
Although it helps reduce financial risks, liability insurance has limits. If accident costs exceed coverage, the driver pays the rest. Many choose extra protection since car insurance rates in Missouri vary by coverage, history, and other factors.
Frequently Asked Questions
What influences car insurance rates in Missouri?
Rates depend on driving history, location, age, credit score, and coverage level. Urban areas and high-risk drivers typically pay more. Look at the factors that affect your car insurance premiums.
How can I lower my Missouri car insurance premiums?
Increase deductibles, bundle policies, maintain a clean record, and use discounts like a safe driver or full payment savings.
What is the difference between minimum and full coverage in Missouri?
Minimum coverage meets state requirements but won’t cover your damages. Full coverage includes comprehensive and collision protection.
Are there discounts for young drivers in Missouri?
Yes, insurers offer discounts for good students, safe drivers, and driver education. Adding them to a family policy can also lower costs. Learn more how to teach your teen to drive.
How can high-risk drivers find affordable insurance in Missouri?
Compare quotes from specialized insurers, take defensive driving courses, and consider usage-based insurance to reduce costs. Start comparing total coverage auto insurance rates by entering your ZIP code here.
What’s the best insurance provider for rural Missouri drivers?
Travelers and American Family offer competitive rates for rural areas, where lower traffic and accident risks often mean cheaper premiums.
Do rideshare drivers need special insurance in Missouri?
Yes, standard policies don’t cover ridesharing. Companies like Farmers and Progressive offer coverage for Uber and Lyft drivers. Get cheap rideshare insurance here.
What does an A++ financial rating mean for an insurance company?
It indicates strong financial stability, ensuring the insurer can pay claims reliably, even in widespread disasters. Explore your car insurance options by entering your ZIP code and finding which companies have the lowest rates.
How does Missouri’s fault-based system affect claims?
Missouri operates a fault system, with the driver who caused the accident having to pay the damages. You can choose to present a claim to their insurance or use your own if you have cheap, full coverage car insurance in Missouri.
How do insurance rates vary between Missouri cities?
It is more expensive in cities such as St. Louis because of traffic and theft. Rural areas and small towns typically have lower premiums. Read more about how accidents change your car insurance rates.
Get a FREE Quote in Minutes
Insurance rates change constantly — we help you stay ahead by making it easy to compare top options and save.