Auto Insurance in New York, New York [Can’t-Miss Guide]

Free Auto Insurance Comparison

Enter your ZIP code below to compare auto insurance rates.

secured lock Secured with SHA-256 Encryption

Maria Hanson

Insurance and Finance Writer

Maria Hanson grew up with a unique passion and understanding of both the automotive and insurance industries. With one grandfather in auto mechanics and another working in insurance, you could say automotive insurance is in her blood. Her love of research and finance serves her well in studying insurance trends and liability.  Maria has expanded her scope of expertise to home, health, and life...

Insurance and Finance Writer

Dani Best

Licensed Insurance Producer

Dani Best has been a licensed insurance producer for nearly 10 years. Dani began her insurance career in a sales role with State Farm in 2014. During her time in sales, she graduated with her Bachelors in Psychology from Capella University and is currently earning her Masters in Marriage and Family Therapy. Since 2014, Dani has held and maintains licenses in Life, Disability, Property, and Casualt...

Licensed Insurance Producer

UPDATED: Jan 6, 2024

Advertiser Disclosure

It’s all about you. We want to help you make the right coverage choices.

Advertiser Disclosure: We strive to help you make confident insurance decisions. Comparison shopping should be easy. We partner with top insurance providers. This doesn’t influence our content. Our opinions are our own.

Editorial Guidelines: We are a free online resource for anyone interested in learning more about auto insurance. Our goal is to be an objective, third-party resource for everything auto insurance related. We update our site regularly, and all content is reviewed by auto insurance experts.

New York StatisticsDetails
City Population8,622,698
City Density28,429 people per square mile
Average Cost of Car Insurance$5,780.61
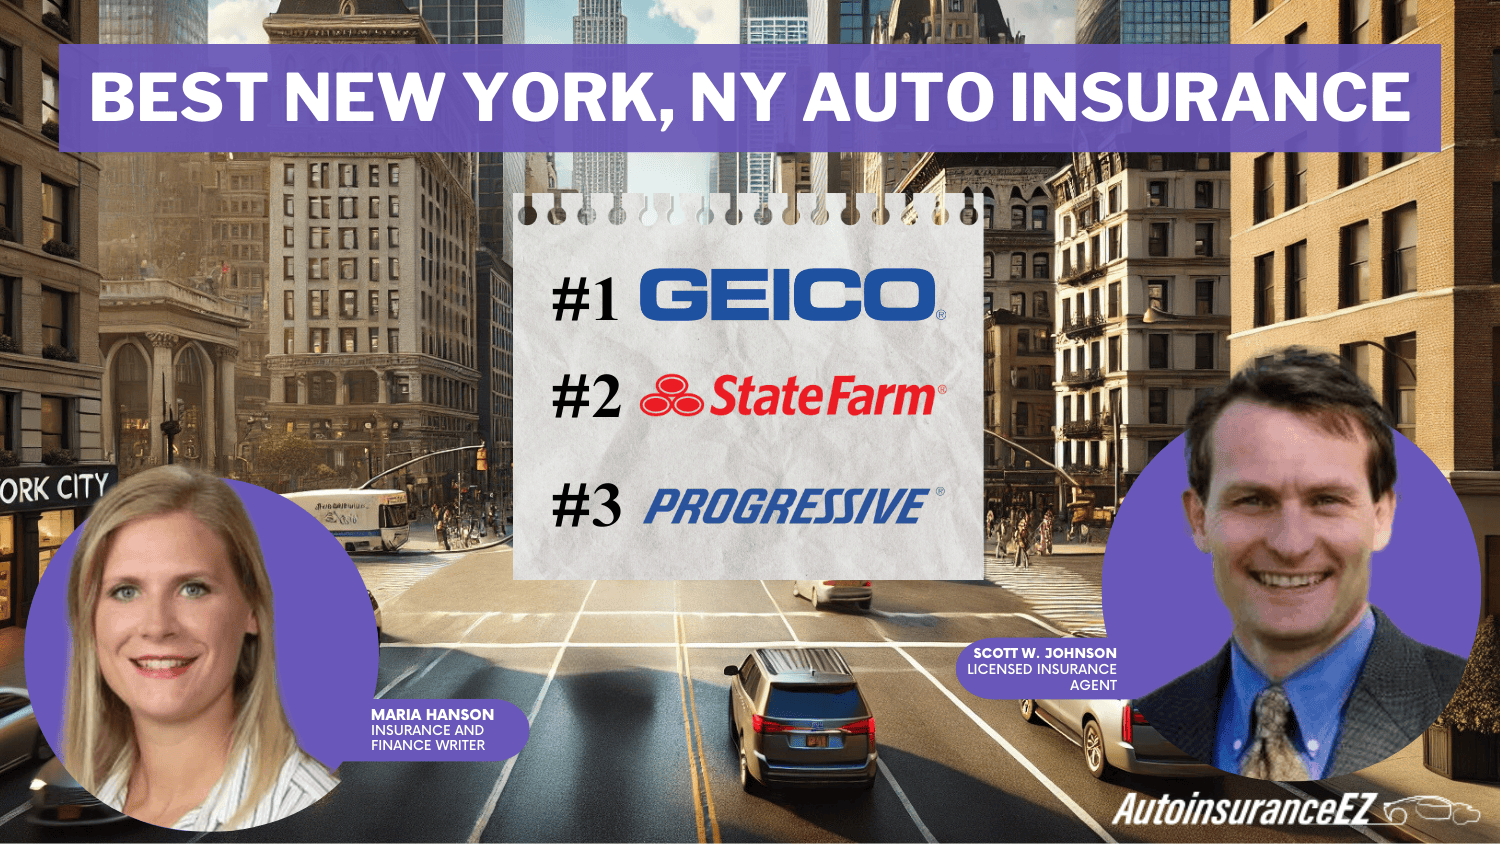
Cheapest Car Insurance CompanyGeico
Road ConditionsPoor share: 46%
Mediocre share: 23%
Fair: 13%
Good: 18%
VOC: $719

Compare RatesStart Now →

Infamously known as the Big Apple, New York, New York (or New York City) is the most populous city in the United States.

The city alone has a population of approximately 8.6 million people, with over 800 different languages used in the region. Not only is it home to the infamous Statue of Liberty, but to other historical landmarks in America, like the Empire State Building, Central Park, and Times Square.

While it is a known fact the Big Apple has one of the most expansive subways systems in the world, car insurance is still relevant to many individuals living in the city.

It’s not the most favored thing to discuss, and rightfully so, as it could get a bit overwhelming understanding rates and sophisticated jargon that completely leaves your head spinning.

We’ve got you.

We’ve taken the liberty of digesting tons of information about car insurance in the city of New York in this complete, comprehensive guide. What is the best coverage? What are the most affordable rates?

We sifted through tons of information to answer those questions for you. But wait, there’s more.

We’ll also talk about things that could affect your rates, along with important facts on roadways and such.

So let’s get to it.

You can start by using our free tool by entering your zip code above or simply keep reading this guide to learn more.

Table of Contents

The Cost of Car Insurance in New York City

What are the factors that car insurance companies utilize that could affect your rates?

While this can be common knowledge to some, there are indeed factors that most people are unaware of and sometimes fail to consider.

Look no further — we’ll address common factors such as age, gender, and location.

But that’s not all: we’ll be discussing other factors that may not be on your radar, like commute times.

Keep reading to find out more.

Read more: Is it a bad idea to use an old address for your auto insurance?

Male vs. Female vs. Age

Age and gender are some of the most prominent factors that insurers factor in when determining rates.

According to DataUSA, the median age for individuals living in New York City is 36.6.

Age17253560
Average Annual Rate$14,618.00$5,541.95$5,066.55$4,702.01

Compare RatesStart Now →

Luckily enough, the average annual rate for those near the same age bracket is $5,066.55, so most residents living in the Big Apple don’t experience the high rates that accompany younger (and assumed “inexperienced”) drivers.

Below is data highlighting average annual rates for males and females in New York City.

DemographicSingle 17-year old femaleSingle 17-year old maleSingle 25-year old femaleSingle 25-year old maleMarried 35-year old femaleMarried 35-year old maleMarried 60-year old femaleMarried 60-year old male
Average Annual Rates$12,988.41$16,247.58$5,384.78$5,699.13$5,144.36$4,988.73$4,681.38$4,722.65

Compare RatesStart Now →

Overall, the typical male in NYC is paying more than his female counterpart.

Furthermore, the cheapest insurance premiums in NYC were paid by 60-year-olds, supporting the theory that older drivers drive less and overall are less of a liability.

Cheapest ZIP Codes in New York City

Where you live in New York City could also raise or lower your rates.

Zip CodeAverage Annual Rate
10001$6,187.75
10002$6,283.05
10003$6,103.20
10004$6,132.00
10005$6,150.55
10006$6,150.55
10007$6,152.52
10009$6,283.29
10010$5,847.38
10011$6,060.67
10012$6,105.24
10013$6,073.95
10014$6,075.96
10016$5,842.83
10017$5,830.45
10018$6,187.75
10019$5,827.81
10020$5,857.14
10021$5,783.72
10022$5,828.18
10023$5,780.61
10024$5,793.64
10025$6,473.98
10026$6,864.98
10027$6,868.58
10028$5,819.47
10029$6,446.14
10030$7,277.72
10031$7,277.72
10032$7,308.31
10033$7,308.65
10034$7,408.79
10035$7,184.24
10036$5,828.18
10037$7,283.01
10038$6,196.78
10039$7,305.06
10040$7,300.81
10041$7,094.01
10044$6,480.45
10045$6,466.81
10055$6,361.03
10060$7,241.16
10065$6,286.05
10069$6,500.22
10075$5,926.57
10090$7,241.16
10095$7,241.16
10103$6,361.03
10104$6,361.03
10105$6,361.03
10106$6,361.03
10107$6,361.03
10110$6,466.71
10111$6,361.03
10112$6,361.03
10115$6,527.29
10118$6,584.61
10119$6,682.43
10120$6,682.43
10121$6,682.43
10122$6,682.43
10123$6,682.43
10128$5,924.72
10151$6,444.14
10152$6,444.14
10153$6,437.36
10154$6,437.36
10155$6,437.36
10158$6,445.22
10161$6,411.66
10162$6,002.91
10165$6,437.36
10166$6,437.36
10167$6,437.36
10168$6,221.63
10169$6,221.63
10170$6,221.63
10171$6,221.63
10172$6,229.49
10173$6,221.63
10174$6,221.63
10175$6,221.63
10176$6,221.63
10177$6,221.63
10178$6,229.49
10199$6,305.14
10270$6,503.26
10271$6,503.26
10278$6,503.26
10279$6,503.26
10280$6,146.59
10281$6,524.40
10282$6,455.53
10301$6,855.12
10302$6,897.81
10303$6,894.63
10304$6,911.15
10305$6,911.15
10306$6,919.58
10307$6,853.41
10308$6,875.88
10309$6,854.28
10310$6,857.21
10312$6,857.96
10314$6,849.70
10451$9,062.76
10452$9,097.53
10453$8,812.75
10454$9,116.81
10455$9,158.51
10456$9,211.85
10457$9,076.75
10458$8,211.09
10459$8,874.35
10460$8,559.68
10461$7,919.58
10462$8,074.44
10463$7,921.45
10464$7,290.57
10465$7,634.29
10466$8,166.42
10467$8,147.36
10468$8,243.53
10469$8,113.87
10470$7,318.04
10471$7,157.51
10472$8,362.38
10473$8,001.24
10474$9,115.00
10475$7,970.78
11005$7,733.02
11201$8,502.16
11203$10,096.41
11204$9,108.90
11205$9,308.70
11206$9,874.39
11207$10,476.23
11208$10,055.22
11209$8,556.92
11210$9,541.90
11211$9,245.06
11212$10,576.93
11213$10,499.21
11214$9,154.70
11215$8,721.63
11216$10,296.06
11217$8,619.43
11218$9,063.14
11219$9,087.62
11220$8,604.58
11221$10,297.30
11222$8,971.90
11223$9,358.44
11224$9,252.85
11225$10,297.86
11226$9,746.91
11228$8,659.25
11229$9,291.58
11230$9,337.21
11231$8,495.83
11232$8,910.23
11233$10,545.72
11234$9,632.57
11235$9,567.09
11236$10,080.76
11237$9,531.70
11238$9,442.09
11239$10,214.05
11426$7,743.58

Compare RatesStart Now →

As you can see, there’s nearly a $5,000 difference between the least expensive and most expensive ZIP codes, proving that location acts as a crucial component in rate makeup.

If you are living in the Manhattan area, especially in the Upper East Side and Upper West Side, there’s good news. You’re most likely to have the lowest rates in the city.

Individuals living in the borough of Brooklyn, however, are among those with the highest rates on average. Keep in mind that Brooklyn is the most populated borough in the region, with over 2.5 million people living in the area.

Overall, as congestion rises in the city, collisions are bound to occur, creating a liability for anyone traveling within the city.

What’s the best car insurance company in New York?

So far, we’ve considered factors that can make a significant impact on your rates. As sobering as it may seem, some companies do give you a decent bang for your buck.

Thus, we’ve broken down rates provided by insurers based on credit history, commute rates, and more.

Let’s see who’s offering the cheapest rates for car insurance in the Big Apple.

Cheapest Car Insurance Rates by Company

The table below displays the rates and average for top providers in New York City.

GroupMarried 35-year old femaleMarried 35-year old maleMarried 60-year old femaleMarried 60-year old maleSingle 17-year old femaleSingle 17-year old maleSingle 25-year old femaleSingle 25-year old maleAverage
Allstate$5,703.82$5,227.08$5,464.66$5,511.16$17,125.99$18,077.93$5,330.95$5,238.83$8,460.05
Geico$2,738.42$2,636.39$2,634.53$2,595.91$5,647.46$8,724.82$2,451.35$2,515.94$3,743.10
Liberty Mutual$9,421.70$9,421.70$8,768.50$8,768.50$18,426.39$26,711.32$9,421.70$10,013.66$12,619.18
Nationwide$5,404.19$5,404.19$5,077.75$5,077.75$9,897.76$14,953.02$5,404.19$7,000.89$7,277.47
Progressive$3,847.65$3,447.56$2,963.45$3,046.47$12,506.41$13,481.83$4,768.68$4,392.90$6,056.87
State Farm$4,423.46$4,423.46$3,886.98$3,886.98$12,906.93$15,778.62$4,890.11$5,096.12$6,911.58
Travelers$6,227.98$6,008.94$5,598.19$5,812.03$13,807.22$16,070.91$6,422.81$6,448.54$8,299.58
USAA$3,387.66$3,340.53$3,056.96$3,082.41$13,589.12$16,182.21$4,388.41$4,886.12$6,489.18

Compare RatesStart Now →

As you can see from the data table, Geico, with an average of $3,743.10, offers the cheapest insurance from the bunch.

This is nearly $9,000 dollars cheaper than the most expensive provider, Liberty Mutual.

Thus, as you can identify, insurers offer individuals various rates. Keep in mind that some demographics alone may be cheaper than the average of the entire group, so just because one has an expensive average doesn’t mean you can’t find deals within that company.

Take Progressive, for instance. Although they have average annual rates of $6,056.87 overall, married 35-year-olds are paying about half for their car insurance.

Best Car Insurance for Commute Rates

Practical matters like your daily commute may also impact your rates.

Group10 miles commute. 6000 annual mileage.25 miles commute. 12000 annual mileage.Average
Allstate$8,337.62$8,582.49$8,460.06
Geico$3,645.84$3,840.37$3,743.11
Liberty Mutual$12,252.01$12,986.35$12,619.18
Nationwide$7,277.47$7,277.47$7,277.47
Progressive$6,056.87$6,056.87$6,056.87
State Farm$6,649.67$7,173.50$6,911.59
Travelers$8,299.58$8,299.58$8,299.58
USAA$6,422.01$6,556.34$6,489.18

Compare RatesStart Now →

At a quick glance, Geico offers the cheapest rates; however, they bump up their rates slightly for longer commutes.

Travelers, Progressive, and Nationwide, though more expensive overall, give their clients a break when it comes to commute and don’t alter their prices at all.

Definitely something to consider.

Best Car Insurance for Coverage Level Rates

Everyone starts off with a basic amount of coverage. What if you wanted to increase your coverage levels for whatever reason?

GroupHighLowMediumAverage
Allstate$9,666.43$7,334.68$8,379.06$8,460.06
Geico$4,049.19$3,473.17$3,706.95$3,743.10
Liberty Mutual$13,296.72$11,975.93$12,584.89$12,619.18
Nationwide$7,953.69$6,693.37$7,185.35$7,277.47
Progressive$6,538.66$5,636.33$5,995.63$6,056.87
State Farm$7,304.00$6,473.21$6,957.54$6,911.58
Travelers$9,076.69$7,668.66$8,153.39$8,299.58
USAA$6,753.12$6,267.22$6,447.19$6,489.18

Compare RatesStart Now →

USAA, though it does not have the lowest average, has a smaller rate change. This is followed by Liberty Mutual.

Allstate, Nationwide, and Travelers had among the highest `rate changes when switching from low or basic coverage to that of a higher coverage.

Best Car Insurance for Credit History Rates

Your credit history is another key factor that companies can and will use when assessing your yearly premiums for car insurance.

Let’s take a look.

GroupFairGoodPoorAverage
Allstate$6,976.23$5,853.98$12,549.95$8,460.05
Geico$3,446.50$3,093.37$4,689.44$3,743.10
Liberty Mutual$11,537.19$8,605.28$17,715.08$12,619.18
Nationwide$7,277.47$7,277.47$7,277.47$7,277.47
Progressive$4,764.69$3,398.72$10,007.20$6,056.87
State Farm$6,121.40$4,862.01$9,751.34$6,911.58
Travelers$7,025.44$5,929.64$11,943.65$8,299.58
USAA$5,017.27$4,404.27$10,045.99$6,489.18

Compare RatesStart Now →

While companies like Nationwide don’t penalize you for a decline in credit status, other companies are not as forgiving.

Take Liberty Mutual, for example. The difference between good and poor credit is over $9,000.

Geico offers the least amount of change between good and bad credit. Nationwide also provides low rates on average overall.

Best Car Insurance for Driving Record Rates

Having a good driving record goes a long way, especially when it comes to your insurance rates.

GroupClean recordWith 1 accidentWith 1 DUIWith 1 speeding violationAverage
Allstate$7,089.19$7,089.19$10,588.15$9,073.68$8,255.51
Geico$2,883.95$3,146.78$6,057.73$2,883.95$4,029.49
Liberty Mutual$9,912.48$9,912.48$20,739.30$9,912.48$13,521.42
Nationwide$5,462.37$5,462.37$12,589.36$5,595.77$7,838.03
Progressive$5,875.96$5,875.96$6,554.29$5,921.27$6,102.07
State Farm$6,564.81$6,564.81$7,258.36$7,258.36$6,795.99
Travelers$7,045.87$8,900.58$9,008.64$8,243.22$8,318.36
USAA$5,809.04$5,901.27$8,345.12$5,901.27$6,685.14

Compare RatesStart Now →

Due to the number of people living in such small proximity, it’s safe to assume that accidents will happen. That’s why it’s so good to be prepared with higher amounts of coverage, especially with the knowledge that your driving record can be impacted by incidents.

Car Insurance Factors in New York City

Knowing what factors impact your rate is one thing. Understanding how those rates come to be is a different and still rather important matter.

Keep reading to learn more.

Metro Report – Growth and Prosperity

The Bookings Institute’s annual Metro Monitor Report indicates the economic performance of the 100 largest metropolitan regions in the U.S.

According to the report, New York City ranks 19th in growth and 39th in prosperity nationwide.

Check out the details for growth in New York City.

Metropolitan Statistical AreaChange in Number of JobsChange in Gross Metropolitan ProductChange in Jobs at Young Firms
New York-Newark-New Jersey-NY-NJ-PA area8.10%16.80%4.10%

Compare RatesStart Now →

Below are details for prosperity in New York City.

Metropolitan Statistical AreaChange in ProductivityChange in Standard of LivingChange in Average Annual Wage
New York-Newark-New Jersey-NY-NJ-PA area8.10%10.60%0.70%

Compare RatesStart Now →

Though the percentage change in average annual wages was among the worst-performing, overall, New York City still ranks among the best performing cities in the nation.

Median Household Income

While New York City ranks among the best cities in the nation, there is still an important question: just how much money is spent annually on car insurance?

According to DataUSA, households in New York City have a median annual income of $60,879 (this is a bit more than the national average for the United States at $60,336).

So just how much of their annual income are residents in the Big Apple spending on car insurance?

If the median household income in New York City is $60,879  and the average annual cost for insurance in the area is $5780.61, residents are spending roughly 9.5 percent of their annual income on car insurance.

That’s quite a bit. That’s why it pays to shop around to ensure you are getting the best deal for your pockets.

Homeownership in New York City

Do you own your own home? Or do you rent?

Whether you own your home can have an impact on your insurance rates. Thus, it’s something to consider when shopping around for the best possible deals.

Insurance companies see stability in homeownership and believe you are less of a liability if you own your own property.

In 2017, 32.7 percent of housing units in New York, NY, were occupied by their owners.

This number grew from 2016, wherein the percent of homeownership was just 32 percent.

The homeowner stats for New York City are under the national average for owner-occupation, resting at approximately 63.9 percent.

Furthermore, in 2017, the median property value in New York, NY grew to $609,500 from the previous year’s value of $569,700.

Education in New York City

New York City is home to a number of colleges and universities. In 2016 alone, universities awarded over 147,960 degrees to graduates in New York City. The student population of New York, NY, is skewed toward women, with 228,123 male students and 327,999 female students.

The top three universities that awarded degrees were New York University, Columbia University in the City of New York, and CUNY Hunter College.

In the same year, the top majors in New York City in terms of popularity were General Psychology, General Business Administration and Management, and Accounting.

New York City also offers an array of community colleges. With over forty accredited colleges in the area, individuals have a wide array of subjects to choose from.

Wage by Race and Ethnicity in Common Jobs

Some individuals are paid more to work in similar jobs than their counterparts.

This is an important factor because some individuals will be paid higher and have less of a car insurance premium, while those on the lower scale are most likely to pay more.

According to DataUSA, in 2017, the highest paid race/ethnicity of New York City workers was white.

These workers were paid 1.07 times more than Native Hawaiian and Other Pacific Islander workers, who made the second-highest salary of any race/ethnicity. Asian New Yorkers made the third-highest salary that same year.

Wage by Gender in Common Jobs

While the gender wage gap continues to be a controversial topic, statistically speaking, there is a discrepancy between male and female counterparts when it comes to wages.  Data USA’s statistics confirm just that (disclaimer: it is important to note that data is not available on a local level, only state-wise).

In 2017, full-time male employees in New York made 1.29 times more ($78,550) than female employees ($60,672).

Remember, the average annual rate for car insurance in New York City is $5,780.61. What this means is that female workers are paying approximately 9.53 percent of their income in annual premiums, while 7.36 percent of male workers’ annual salary is taken up yearly by rates.

Poverty by Age and Gender

Whether you are living in poverty can determine how you may be impacted when it comes to your car insurance premium.

The Census Bureau utilizes a set of money income thresholds that fluctuate by family size and composition to establish who characterizes as “impoverished.”

In the event that a family’s total income measures to be less than the family’s threshold, it is concluded that that family and each individual member is to be considered living in neediness.

Overall, 19.6 percent of the population for whom poverty status is determined in New York, NY, (1.65M out of 8.42M people) live below the poverty line.

This number is higher than the national average, which is 13.4 percent.

The largest demographic living in poverty are females 25-34, followed by females 35-44 and then females 18-24.

Again, according to DataUSA, the median age for individuals living in the Big Apple is 36.6. Thus, females living in New York City would especially benefit from shopping around to find the best insurance rates as they are affected by lower incomes.

Poverty by Race and Ethnicity

As you have found in the former parts of this article, sex, age, and race can, in any case, affect the percentage of income spent on vehicle premiums.

The most common racial or ethnic group living below the poverty line in New York, NY, is Hispanic, followed by white and black.

Hispanics make up the largest demographic below the New York City poverty line, with 670,016 individuals. Whites make up 516,242. And lastly, the black population makes up 456,091 individuals living in poverty in New York City.

Employment by Occupations

In spite of New York City’s poverty rates and sometimes steep insurance costs, the city’s employment rates experienced growth in the healthy range between 2016 and 2017.

During that one-year period, employment in New York, New York, increased by 1.47 percent from 4.11 million to 4.19 million employees.

The most common job groups, by number of people living in New York, NY, are Office and Administrative Support Occupations (503,560 people), Management Occupations (426,654 people), and Sales and Related Occupations (389,845 people).

Want to explore your options and start saving on auto insurance now? Simply enter your ZIP code in the box below to get started.

Free Auto Insurance Comparison

Enter your ZIP code below to compare auto insurance rates.

secured lock Secured with SHA-256 Encryption

Enter your ZIP code below to compare auto insurance rates.

secured lock Secured with SHA-256 Encryption

Driving in New York City

While it’s important to talk car insurance and the factors that make up rates, it’s also important to discuss road conditions, especially when driving in big cities like New York, New York.

This section will give you a 360-view of your overall driving experience on the road.

Roads in New York

While many would prefer to take the subway in major cities like New York, NY, you could still find a pleasant driving experience with the right information and direction. Find out everything New York City drivers need to know about driving in the city, including major highways, popular road trip sites, and more.

Major Highways

New York City has an astounding 31 active interstates running through its region. These 31 interstates make up 1,730.34 miles of roadway in the state of New York. The active interstates are as follows:

  • I-78, I-81, I-84, I-86, I-87, I-88, I-90, I-95, I-99
  • I-278, I-478, I-678, I-878, I-481, I-781, I-684, I-287, I-587, I-687, I-787, I-190, I-290, I-390, I-490, I-590, I-690, I-790, I-890, I-990, I-295, I-495, I-695, I-895

The Big Apple has the largest subway system in the world (472 stations to be exact). The city comes in eighth in the nation when estimated by yearly ridership.

Spectacular, right?

Subway riders pay with the MetroCard, also acceptable on all other rapid transit systems and buses in the city, in addition to the Roosevelt Island tramway.

Tokens were utilized in the past for fares; however, times have changed, as fares are loaded electronically on the card.

The Port Authority Trans-Hudson (PATH) is also a rapid transit system that links Manhattan to Jersey City, Hoboken, Harrison, and Newark, in New Jersey.

A less-supported option in contrast to traveling by rail (or boat) is the New York City turnpike system. The city’s broad system of freeways incorporates four primary Interstate Highways: Interstate 78, Interstate 80, Interstate 87 and Interstate 95.

The Big Apple’s restricted access parkways are clogged most of the time, regardless of being designed to just convey vehicles, rather than business trucks or buses.

If you wish to avoid receiving costly toll violation fines incurred when you end up using high-speed toll lanes without a toll tag, getting E-ZPass would be a good idea.

You can calculate your trip, including tolls, and purchase an E-ZPass on your next car adventure through the city.

Popular Road Trips/Sites

While New York City offers popular sites like the Empire State Building and the infamous Times Square, there are also quirks to the city that you wouldn’t normally find.

Check out the video below:

Whether you want to see the city by foot, boat, or even plane, New York City offers a variety of both daytime and nighttime attractions for individuals and their families that you would be spectacular to experience.

If you are traveling by car, it is important to know the circumstances that you might be up against.

We’re talking road conditions next.

Road Conditions

Though New York City is one of the top cities in the nation, the city is full of roads in bad conditions. This is important because it may affect the wear and tear on your vehicle and ultimately drive up repair costs.

While this was a problem highlighted a couple of years ago by CBS New York, there is little that has been done since then.

Furthermore, a study by the National Transportation Research Group recorded the pavement conditions and extra vehicle operating costs in a variety of urban areas with populations of 500,000 individuals or more. New York City was included in this study, with the following stats revealed:

  • Poor Share — 46 percent
  • Mediocre Share — 23 percent
  • Fair Share — 13 percent
  • Good Share — 18 percent
  • Vehicle Operating Costs — $719

We’ll talk speeding and red light cameras next.

Does New York City use speeding or red light cameras?

New York City is one out of 142 communities in 15 states who currently utilize speed cameras.

The city plans to implement 10 times its current use of over 200 red light cameras, projecting 2,000 cameras in 2021.

Vehicles in New York City

Every city possesses its own unique trends for the most popular vehicles and vehicle ownership.

It’s interesting to know about these trends, but also important to understand the potential speed traps and vehicle theft rates in your city for your safety and overall awareness.

Let’s get to it.

Most Popular Vehicles Owned

The most popular vehicle owned in New York City is the BMW 328i.

With its technological advances and high-speed acceleration power, one can see why it’s so appealing to bustling residents in NYC.

Next, we’ll see how many cars individuals in New York City own.

How Many Cars Per Household

So just how many cars do NYC residents own?

Most individuals own zero cars. This is followed by the ownership of one car.

This is not surprising, with New York City having the most extensive public transportation system in the nation.

Households Without a Car

The data below from 2015 and 2016 shows the percentage of households in the city that rely on transportation options other than their own vehicles.

YearHouseholds Without VehiclesVehicles Per Household
201554.50%0.63
201654.40%0.63

Compare RatesStart Now →

As you can see, the percentage of households without vehicles slightly decreased between 2015 and 2016, while the number of vehicles per household stayed the same.

Speed Traps in New York City

Speed traps are instances where law enforcement hides their car, all the while tracking drivers’ speeds through the use of radar guns.

Speed traps are designed to inhibit speeding and promote safer driving habits, but they also have the potential to bring in substantial revenue for a city.

New York City ranked fifth in the top 10 speed trap cities in the state of New York. The number of speed traps listed in the city is five.

Vehicle Theft in New York City

Have you ever wondered how safe your vehicle is in New York City? Well, the FBI’s 2018 Crime in the U.S. Report revealed that there were 5,534 motor vehicle thefts in New York City in that year alone.

Neighborhood Scout has indicated that the following neighborhoods are the safest areas in the city that residents should consider:

  • W 218th St / Broadway
  • Randalls Island Park / Wards Island Park
  • E 82nd St / 2nd Ave
  • Madison Ave / E 50th St
  • Madison Ave / E 96th St
  • Main St / East Rd
  • E 53rd St / 2nd Ave
  • E 89th St / 1st Ave
  • W 70th St / West End Ave
  • Madison Ave / E 90th St

According to Neighborhood Scout, your chances of becoming a victim of violent crime in New York City (Manhattan) are approximately one out of 210 per 1,000 residents.

Your chance of being a victim of violent crime in New York State is a bit higher than in New York City, which is a one out of 280 chance.

Check out the data regarding incidents of violent crime in the Big Apple in 2017 below:

New York Violent Crimes 2017MurderRapeRobberyAssault
Report Total524282,5974,843
Rate Per 1,000 People0.030.261.562.91

Compare RatesStart Now →

Below are New York City’s annual number of crimes as of 2017.

New York Annual CrimesViolentPropertyTotal
Number of Crimes7,92027,32335,243
Crime Rate (Per 1,000 Residents)4.7616.4121.17

Compare RatesStart Now →

Neighborhood Scout also reported that New York City is safer than 30 percent of U.S. cities, rating it number 30 in the crime index (with 100 being the safest).

Consider some of the safer areas listed above.

Traffic

Getting stuck in traffic is no fun. Next, we’ll have an in-depth look at the average commute time city residents face daily, transportation stats, road safety data, and so much more in New York City.

Read on!

Traffic Congestion in New York City

It’s not surprising to learn that New York City ranks fairly high in terms of traffic congestion in the state.

Below is the congestion data collected by INRIX’s Annual Traffic Scorecard Study.

Urban AreaHours Lost in CongestionCost of Congestion Per DriverInner City Travel Time (Minutes)Inner City Last Mile Speed (mph)
New York City133$1,85979
Buffalo72$1,009611

Compare RatesStart Now →

New York is currently underway to charge drivers for congestion in 2021, in hopes of raising money for public transit improvements and keeping individuals out of congested areas which ultimately would create a better flow from traffic.

Transportation

According to DataUSA, employees in New York, NY, have a longer commute time of 40 minutes than the normal U.S. worker, whose average commute time is 25.5 minutes.

Furthermore, 7.71 percent of the workforce in New York, NY, have “super commutes” in excess of 90 minutes.

So, what transportation methods do New York City residents use to get to work?

In 2017, the most common method of travel for 55.8 percent of New York City residents was public transit. This was followed by those who drove alone (22.3 percent) and those who walked (10.1 percent).

Busiest Highways

According to data presented by the U.S. Department of Transportation’s Federal Highway Administration, New York City area has several busy highways.

They are the following:

  • I-95, 14 lanes
  • I-287, 13 lanes
  • I-78, 12 lanes

The number of lanes represents the total number of lanes in both directions — toll plazas, however, are not included.

How safe are New York City’s streets and roads?

The National Highway Transportation Safety Administration (NHTSA) has also collected statistics regarding driving fatalities in the New York City area.

Let’s take a look at the table below to see what they found for the following counties in New York City: New York County (Manhattan), Kings County (Brooklyn), Bronx County (the Bronx), Richmond (Staten Island), and Queens County (Queens).

First up is data for fatalities (all crashes) in New York City counties.

CountyFatalities
2014
2015201620172018Fatalaties Per 100k Population
2014
2015201620172018
Bronx County35404940362.442.783.392.782.51
Kings County786953565632.642.032.162.17
New York County39284838272.391.712.932.331.66
Queens County86786159693.743.382.642.573.03
Richmond County1226191472.545.54.012.941.47

Compare RatesStart Now →

As you can see, individuals living in Queens had the most crashes out of all New York City Counties.

Next, we’ll take a look at fatalities in crashes in the New York City area regarding alcohol-impaired drivers with BAC levels of .08 and above.

CountyFatalities
2014
2015201620172018Fatalaties Per 100k Population
2014
2015201620172018
Bronx County1281214110.840.560.830.970.77
Kings County17141514170.650.540.570.540.66
New York County8571070.490.310.430.610.43
Queens County20222020190.870.950.870.870.83
Richmond County462430.851.270.420.840.63

Compare RatesStart Now →

Again, Queens had the highest fatalities in New York City.

Richmond County had the least alcohol-impaired fatalities out of the bunch.

The next table reveals the crash fatalities for single vehicles by county in the New York City area in 2017.

CountyFatalities
2014
2015201620172018Fatalaties Per 100k Population
2014
2015201620172018
Bronx County23263628181.611.82.491.941.26
Kings County57564337372.192.151.651.431.43
New York County30214430201.841.282.691.841.23
Queens County67544534502.912.341.951.482.19
Richmond County61912741.274.022.531.470.84

Compare RatesStart Now →

Queens County had the highest number of crash fatalities caused by a single vehicle.

This was closely followed by Kings County.

Below are the 2017 fatalities in crashes involving speeding by county in the New York City area.

CountyFatalities
2014
2015201620172018Fatalaties Per 100k Population
2014
2015201620172018
Bronx County1310111240.910.690.760.830.28
Kings County1815111350.690.570.420.50.19
New York County661630.370.370.060.370.18
Queens County22291918190.961.260.820.780.83
Richmond County186520.211.691.271.050.42

Compare RatesStart Now →

Is it a surprise which county comes at the highest and lowest?

CountyFatalities
2014
2015201620172018Fatalaties Per 100k Population
2014
2015201620172018
Bronx County1199870.770.620.620.560.49
Kings County11119940.420.420.340.350.15
New York County322730.180.120.120.430.18
Queens County2927189121.261.170.780.390.53
Richmond County393420.641.90.630.840.42

Compare RatesStart Now →

This table displays 2017 fatalities involving a roadway departure by counties in the New York City area.

Below are 2017 fatalities in the New York City area by county involving an intersection (or intersection related).

CountyFatalities
2014
2015201620172018Fatalaties Per 100k Population
2014
2015201620172018
Bronx County18202414181.261.391.660.971.26
Kings County523932333421.491.231.271.32
New York County27173524161.661.042.141.470.98
Queens County37342834471.611.471.211.482.06
Richmond County71213831.482.542.741.680.63

Compare RatesStart Now →

Kings County actually had the highest number of these fatalities, followed by Queens.

CountyFatalities
2014
2015201620172018Fatalaties Per 100k Population
2014
2015201620172018
Bronx County757940.490.350.480.630.28
Kings County1375730.50.270.190.270.12
New York County244720.120.240.240.430.12
Queens County21261912100.911.130.820.520.44
Richmond County2115520.422.331.051.050.42

Compare RatesStart Now →

Here are the passenger car occupant fatalities New York City’s counties in 2017.

Occupants of passenger cars are not the only people involved in car crashes, either. Sometimes pedestrians and cyclists pay the price.

Below are pedestrian fatalities in New York City County.

CountyFatalities
2014
2015201620172018Fatalaties Per 100k Population
2014
2015201620172018
Bronx County15222821161.051.531.941.461.12
Kings County44463425341.691.761.30.961.32
New York County24203917181.471.222.381.041.11
Queens County37342928401.611.471.261.221.76
Richmond County697441.271.91.480.840.84

Compare RatesStart Now →

Kings County had the highest number of pedestrian fatalities.

This was followed by Queens.

These are the cyclist fatalities by county in the New York City area for 2017.

CountyFatalities
2014
2015201620172018Fatalaties Per 100k Population
2014
2015201620172018
Bronx County123120.070.140.210.070.14
Kings County6491030.230.150.340.390.12
New York County513820.310.060.180.490.12
Queens County853320.350.220.130.130.09
Richmond County0110000.210.2100

Compare RatesStart Now →

Richmond County and the Bronx rarely had cyclist fatalities in 2017.

The following table reveals additional data released by NHTSA regarding New York highways with the highest incidence of crash fatalities.

New York Road TypeFatal Crashes
Rural45
Urban22
Freeway and Expressway27
Other267
Minor Arterial102
Collector Arterial63
Local407
Unknown0
Total Fatal Crashes933

Compare RatesStart Now →

Based on the data above, most fatal crashes occurred on local roads. There was also a high number of accidents categorized as “other.”

The U.S. Department of Transportation (DOT) collected data regarding fatalities and injuries in New York City due to highway and railroad crashes in recent years, which are listed out in the table below.

Highway User SpeedCalendar YearCountyHighwayHighway User TypeRail Equipment TypeNon-suicide fatalityNon-suicide injury
02012QUEENSLITTLE NECK PARKWAYPedestrianD10
102015QUEENSMASPETH AVENUETruck-trailerFreight Train01
102016BRONXAVENUE CPick-up truckLight Loco(s)00

Compare RatesStart Now →

According to the data, most incidents occurred in Queens via freight trains, and in the Bronx via pickup trucks.

Allstate America’s Best Drivers Report

Allstate America’s Best Drivers Report helps identify which of the 200 largest U.S. cities have the safest drivers.

According to the report, New York City is listed as the 111th-safest city to drive in 2019.

On average, residents of the Big Apple also went around 8.8 years between filing each claim Allstate’s report also revealed that drivers encounter 31.9 hard-braking events per 1,000 miles.

Ridesharing

With its tourist attractions and live entertainment, New York City is one of the most popular places in the world to visit. And traveling throughout the city is easy thanks to the ridesharing services available.

Here is a list of ridesharing operations currently operating within the city according to Rideguru.com:

  • Uber X
  • Lyft
  • Carmel
  • Taxi
  • Carmel LX
  • Carmel DX
  • Lyft Premier
  • Uber Black
  • Lyft Lux

E-star Repair Shops

Accidents do happen. And unfortunately, living in a congested city can make you prone to more incidents than others.

If you live in New York City and find yourself in this predicament, no worries. Esurance created E-star to help individuals with car damage find reputable shops in its network of over 1,400 facilities.

Waste no time! If you were recently involved in a collision, check out the top 10 repair shops in New York City (Manhattan).

Shop NameAddressContact Info
AUTO CARE EAST INC.243 E 94TH ST
NEW YORK NY 10128
email: [email protected]
P: (212) 988-1515
F: (212) 369-4657
BERGEN BROOKSIDE AUTO BODY,INC.83 ZABRISKIE ST
HACKENSACK NJ 07601
email: [email protected]
P: (201) 342-8253
F: (201) 342-7022
DELTA COLLISION529 EAST 84TH STREET
BROOKLYN NY 11236
email: [email protected]
P: (718) 444-7266
F: (718) 209-1742
FORT LEE ROAD AUTO BODY237 FORT LEE RD
TEANECK NJ 07666
email: [email protected]
P: (201) 836-0752
F: (201) 692-0415
FRANCESCO AUTO BODY, INC.782 NEPPERHAN AVE
YONKERS NY 10703
P: (914) 423-0329
F: (914) 423-0916
LYNDHURST AUTO BODY LLC111 PARK AVE
LYNDHURST NJ 07071
email: [email protected]
P: (201) 939-2133
F: (201) 935-4179
MAIN AUTO BODY650 OUTWATER LN
LODI NJ 07644
email: [email protected]
P: (973) 340-9884
F: (973) 340-2343
RAY MEES AUTO COACH, INC7718 TONNELLE AVE
NORTH BERGEN NJ 07047
email: [email protected]
P: (201) 869-2286
F: (201) 869-1072
S.O.S. AUTO BODY, INC.95-20 98TH STREET
OZONE PARK NY 11416
email: [email protected]
P: (718) 641-5909
F: (718) 641-3699
SERNIO'S AUTO BODY INC.896 COMMUNIPAW AVE
JERSEY CITY NJ 07304
email: [email protected]
P: (201) 795-1673
F: (201) 795-4093

Compare RatesStart Now →

Weather

Residents in New York City experience a variety of temperatures throughout the year. Whether in its chilly winters or humid summers, or weeks mixed with sun and snow, residents have learned to adapt to this everchanging weather.

U.S. Climate Data releases studies regarding average temperatures nationwide by city.

Here are the average temperatures for New York City:

  • Annual High Temperature — 62.3 F
  • Annual Low Temperature — 48 F
  • Average Temperature — 55.15 F
  • Average Sunshine – 2677 hours
  • Average Annual Precipitation
    • Rainfall– 46.23 inches
    • Snowfall–unavailable

When discussing the weather, one also has to take into account natural disasters.

The number of natural disasters in New York County (17) is greater than the U.S. average (13).

New York City is unfortunately prone to a number of natural disasters, including hurricanes, floods, storms, blizzards, explosions, heavy rain, power outages, snowstorms, and water shortages.

Given mother nature’s outpour on the city, it may be best to look at additional coverage to protect your vehicle.

Public Transit

We’ve talked about the extensive public transportation system that belongs to the Big Apple. And rightfully so, with over eight million people spread across five boroughs, public transportation in New York City is a necessity.

But how much does public transportation in New York City cost? That depends on how you’re traveling.

Bus – The New York Metropolitan Transport Authority (MTA) operates the busy bus system in New York. Fares are $2.75 for standard buses and $6.75 for express buses. Fares can be paid in cash or by MetroCard.

One main advantage of paying by MetroCard is that you can transfer for free to other bus or subway services within two hours of your first fare. They cost an initial fee of $1 to purchase but can be reused anytime.

Subway – As with the bus system, you can pay for your fare either with a MetroCard or you can purchase a single ticket. Metrocard fares are $2.75, while single tickets are $3.

Taxi – A traditional approach to getting around, with nostalgic feels. Basic fees begin at $2.50.

Ferry – Because of the amount of water that surrounds New York City, it makes sense that individuals have the luxury of traveling by boat. NYC tickets are not a part of the train system and have to be purchased separately. Adult tickets are $2.75. All ferries have ticket vending machines, which accept cash or credit cards. Tickets can also be bought on board, using the NYC Ferry app, or on the NYC Ferry website.

Aerial Tram – The Roosevelt Island Tramway is an aerial tram that links Roosevelt Island with the Upper East Side of Manhattan. While it is not operated by MTA, you do need a MetroCard to ride the tram. Prices are similar to a subway or bus ride at $2.75 per ticket.

Alternate Transportation

If you aren’t traveling by bus, subway, taxi, or ferry, there are additional options still available.

Rail – The majority of these are commuter-focused lines designed to bring people into the city from the more distant boroughs. You’ll most likely have to buy a ticket for the individual journey at the train station. There is also an e-ticketing app called eTix, available for both Android and iPhone devices, which lets you buy tickets on your phone for the Metro-North Railroad or Long Island Rail Road.

Fares will vary depending on the route you take.

Bicycle – Like many cities around the world, the Big Apple has a bike program wherein you can get access to a large network of bikes located around the city, which you can drop off and pick off at various points.

Citi Bike offers a single ride for just $3 and includes the first 30 minutes of one ride on a classic Citi Bike. It’s an extra $3 for each additional 30 minutes. Also, it’s $12 for a day pass and $24 for a three-day pass.

Pedicab – A fun way to go exploring the city. Fares begin at $3 per minute.

Helicopter – While not the most affordable option, it does offer some of the most exquisite views of the city. Prices vary by company and duration.

Parking in Metro Areas

Where you park in New York City could cost you an arm and a leg if you’re not careful. There are various ways to park, which gives you a better selection.

Street Parking – Many neighborhood streets offer free and cheap parking if you know where to look, but prices vary block by block. You could pay much more if you end up on the wrong block.

SpotAngels provides a street map that includes the duration of parking in New York City and the cost.

Coin Metered Parking / Debit Card Metered Parking – If you’re parking on Sundays in New York City, parking is free. Otherwise, you’ll have to pay throughout the week, Saturdays, and on major holidays.

At a Pay and Display meter, you’ll simply purchase time, grab the receipt, and secure it on your vehicle’s dashboard. At a Pay and Retain meter, you’ll park your car in a metered space, enter the space number directly into the meter, purchase time, and hold the receipt.

Meter parking rates are posted on each parking meter. In The Bronx, Brooklyn, Queens, and Staten Island, the hourly rate is $1. But in some parts in Manhattan, you could pay as much as $3.50 an hour. Rates may vary based on the time of the day, as well.

Mobile App Metered Parking – According to ParkWhiz, an online web-based parking locator, New York City’s parking can cost as low as $9 and as much as $51 dollars. You can book through the ParkWhiz website. Simply present your parking pass to the valet attendant in exchange for valet-ticket.

Charging for Electric Vehicles – The Department of Transportation plans to eliminate 100 traditional parking spaces to make room for electric vehicle charging stations.

Parking Decks – Again, SpotAngels provides a street map that includes parking facilities as well.

Satellite Parking – For places like JFK, parking is pretty reasonable. Parking at the JFK airport costs from $4 for 30 minutes of short-term terminal parking to $18 per day in the official long-term lot. For off-site long term with a shuttle is nine dollars a day.

Air Quality in New York City

The following table reveals the air quality in the New York City area, based on data drawn from the Environmental Protection Agency’s 2016, 2017, and 2018 reports.

New York City Air Quality Index201620172018
Days with AQI366365365
Good Days155154156
Days Moderate181192182
Days Unhealthy for Sensitive Groups281724
Days Unhealthy222
Days Very Unhealthy--1

Compare RatesStart Now →

As you can see, the days for good air quality far outweighed the bad/unhealthy days.

Military/Veterans

If you are currently in active service or previously served in the military, you could be eligible for auto insurance discounts in New York City.

Keep scrolling for everything from a breakdown of veteran stats in the city by service period to the top providers that offer discounts to veterans and members of the military.

Veterans by Service Period

New York, NY, has a large population of military personnel who served in Vietnam, 1.63 times greater than any other conflict.

As of 2017, approximately 185,685 of the veterans living in the Big Apple served in the Vietnam war, while 72,408 individuals served in the second Gulf War. Lastly,  65,999 individuals served in the war in Korea.

Military Bases Within An Hour

New York City has a variety of military bases, but the closest to the city is Fort Hamilton, which sits right inside of the Brooklyn borough.

Fort Hamilton is a combined community comprised of active duty Army, Navy, Air Force, Marines, Coast Guard, National Guard, and Reserve Components.

Military Discounts by Providers

Some of the providers that offer military and veterans car insurance discounts are:

  • Allstate
  • Esurance
  • Framers
  • Geico
  • Liberty Mutual
  • MetLife
  • SafeAuto
  • SafeCo
  • State Farm
  • The General
  • USAA

USAA Available in New York

USAA car insurance in New York City and around the nation is strictly reserved for U.S. military service members and their families.

Check out the table below to see USAA’s rates as compared to competitor carriers and the state average, approximately $4,289.88.

GroupAnnual PremiumCompared to State Average (+/-)Compared to State Average (%)
Allstate$4,740.97$451.0810.51%
Geico$2,428.24-$1,861.64-43.40%
Liberty Mutual$6,540.73$2,250.8552.47%
Nationwide$4,012.93-$276.95-6.46%
Progressive$3,771.15-$518.73-12.09%
State Farm$4,484.58$194.704.54%
Travelers$4,578.79$288.916.73%
USAA$3,761.69-$528.20-12.31%

Compare RatesStart Now →

Looking at the data, aside from Geico, which comes in at 1,861.64 below the state average, USAA beats its competitors and is also a great selection.

Unique City Laws

Before you get behind the wheel in the Big Apple, here’s what you need to know about driving laws in your city and state.

Hands-Free Driving Law

Under New York State’s phone law, you are prohibited from using a handheld mobile telephone or portable electronic device as you drive. The only exception is when contacting law enforcement or other emergency personnel.

While New York City itself doesn’t have any legislation, it is subject to state regulations.

The use of any hand-held cellular phone while driving is prohibited on any New York road. Anyone who violates this law will be issued a traffic violation, which will carry a fine of up to $150.

Sobering, isn’t it?

You’ll want to be safe while driving through the Big Apple, so be sure to practice safe driving.

Food Trucks

Food Trucks are an integral part of New York City, weaving in the very fabric of city culture.

In order to operate a food truck, you must get a license to run a food business regardless of duration. The license is called a Mobile Food Vendor Personal License.

Furthermore, you should also have a decal permit for any food cart or truck where food is sold. This permit is called a “Mobile Food Vending Unit Permit.” Both the license and permit are required to operate a food vending cart or truck in New York City.

The permit expires two years from the previous expiration date. You can call 311 to renew.

For more information, visit New York’s government page here.

Tiny Homes

Generally thought of as a small house under 600 square feet, tiny homes are small homes built on trailers.

In New York, land use regulations dictate how the land can be established. Different land uses and development standards are applicable in various zones.

Once you discover how a particular property is zoned, you’ll be able to determine what uses are allowed on that particular piece of land or property.

If possible, review any Covenants, Conditions, and Restrictions (CC&Rs) to see if tiny homes are available allowed in your community.

Parking Laws

Any vehicle parked or operated illegally in New York City, or with absent or expired registration or inspection notifications, is subject to be towed.

On major legal holidays stopping, standing, and parking is permitted except in areas where rules for stopping, standing, and parking is in effect seven days of the week.

Double parking is illegal at all times.

Furthermore, it is illegal to park within 15 feet of each side of a fire hydrant.

Enter your ZIP code below to compare auto insurance rates.

secured lock Secured with SHA-256 Encryption

New York City Car Insurance FAQs

Where is New York City located?

New York City is located in the northeastern United States. In New York State, New York City sits in the southeast region. It is about halfway between Washington D.C. and Boston. See map.

When is the New York City Marathon?

The New York City Marathon will be held on November 1st, 2020, at 5:00 a.m. PST, 8:00 a.m. EST.

Why is New York City called the Big Apple?

The term was first advanced during the 1920s by John J. Fitz Gerald, a games author for the New York Morning Telegraph. Its prominence since the 1970s is due to some degree to a promotional campaign by the New York tourist authorities.

Will New York City sink?

With global warming affecting the world at alarming rates, predictions for its impact are prominent. New York, which sits below sea level, has been rumored to be in an unlikely situation for some time now.

But as we see our world changing and the effects of global warming presenting starking realities, for some, it is a cause for concern.

[Jon] Leland discussed how the city will be affected by a two-degree increase in global temperatures, the upper limit set forth by the Paris climate deal. “With a two-degree change, the Rockaways are lost,” he said. “J.F.K. Airport is entirely underwater. Southern Queens and a lot of Brooklyn are underwater, especially around the canals.” On the map, lower Manhattan looks a bit like Italy. “Large portions of it—the West Side, especially—are underwater, all the way to Broadway,” he said. “Much of the East Village, too. Avenues B, C, D.” Jersey City is history.

Predictions are only possible, as no one completely has the answers to the future. But we shouldn’t reject narratives based on speculation. We can only hope that convictions would cause counteractive measures as a result of such a situation.

What is the population in New York City?

The population in New York City is 8,622,698, with females (4,510,159) outweighing the male population (4,112,539).

What hotels are in New York City?

There are 1,375 hotels in New York City. How do you find a place to stay? Well, it ultimately depends on your needs and preferred amenities, as well as the time of the year and where you are staying.

But if you’re looking for the cheapest and most affordable, with great ratings, here are a few places to start:

  1. West Side YMCA
  2. Hotel 17
  3. Vanderbilt YMCA

Now that we’ve guided you through everything you need to know about car insurance, rates, stats, vehicles, and roadways in the Big Apple, it’s time for you to get started at finding your rates.

Simply enter your zipcode in our free tool to get started.

Free Auto Insurance Comparison

Enter your ZIP code below to compare auto insurance rates.

secured lock Secured with SHA-256 Encryption