The Ultimate Texas Car Insurance Guide (Costs + Coverage)
Free Auto Insurance Comparison
Enter your ZIP code below to compare auto insurance rates.
![]() Secured with SHA-256 Encryption
Secured with SHA-256 Encryption
Eric Stauffer
Licensed Insurance Agent
Eric Stauffer is an insurance agent and banker-turned-consumer advocate. His priority is educating individuals and families about the different types of insurance coverage. He is passionate about helping consumers find the best coverage for their budgets and personal needs. Eric is the CEO of C Street Media, a full-service marketing firm and the co-founder of ProperCents.com, a financial educat...
Licensed Insurance Agent
UPDATED: Mar 16, 2024
It’s all about you. We want to help you make the right coverage choices.
Advertiser Disclosure: We strive to help you make confident insurance decisions. Comparison shopping should be easy. We partner with top insurance providers. This doesn’t influence our content. Our opinions are our own.
Editorial Guidelines: We are a free online resource for anyone interested in learning more about auto insurance. Our goal is to be an objective, third-party resource for everything auto insurance related. We update our site regularly, and all content is reviewed by auto insurance experts.
| Texas Statistics Summary | Details |
|---|---|
| Road Miles | Total in State: 313,596 Vehicle Miles Driven: 243,076 Million |
| Vehicles | Registered: 20,431,631 Total Stolen: 68,546 |
| State Population | 28,701,845 |
| Most Popular Vehicle | Ford F150 |
| Uninsured Motorists | 14.10% State Rank: 16th |
| Total Driving Fatalities | 2008-2017 Speeding: 12,024 Drunk Driving: 13,450 |
| Annual Average Premiums | Collision: $374.49 Comprehensive: $206.42 Liability: $528.75 |
| Cheapest Providers | State Farm Mutual Auto and USAA |
Commonly known as the Lone Star State, the great state of Texas is the largest continental state in the U.S. with an area of almost 270,000 square miles and over 300,000 miles of roadway.
With a complex terrain, Texas boasts desert valleys, mountains, sandhills, grasslands, rivers, and plateaus. But a beautiful terrain isn’t all Texas has to offer.
Texas is also home to major cities like Houston, San Antonio, and Dallas, and a lesser populated area such as Austin or Fort Worth. With so many large cities, it’s no wonder that Texas’s population is nearly 29 million.
Texas is also one of the 15 most expensive states in the country, even if you live in a nice town like Corpus Christi, Arlington, or El Paso. That’s why it’s so important to shop around and make sure you’re getting the best deal.
If you’re currently one of the 29 million Texas residents or you’re looking to move to the Lone Star state, one important thing is probably on your radar: with all those vehicles on the road, you’re going to need a good car insurance policy.
In this guide, we want to show you how you can get the best Texas auto insurance policy that not only fits your lifestyle but fits your budget as well.
We will cover topics like insurance rates and laws, safety laws, vehicle theft, types of coverage, fatality rates and more.
Ready to start comparing Texas auto insurance rates right now? Use our free tool above by entering your zip code here right now.
Want to do a little more research before you make a decision on your auto insurance policy? Keep reading as we get into coverage and rates below.
Texas Car Insurance Coverage and Rates
Auto insurance rates can be confusing, especially when you have no idea what factors go into creating your unique rate. Coverage type has a lot to do with rate, but most of the time that’s not always the case.
To help you decide what coverage you need that fits into your budget, we are going to explain different coverage types in this next section.
Don’t get stuck overpaying for something you don’t need. For more information on ways to save on your auto insurance policy, pay attention to the section below.
Texas Car Culture
According to the Hartford, a big state means more mileage on your vehicle – but an expensive gas bill doesn’t scare Texans away from buying gas guzzlers. In fact, Texans buy one out of every six pickup trucks sold nationally.
Since having a pickup truck provides you with the freedom to both travel anywhere you need to go and haul anything you need to move, it represents the kind of independent lifestyle that many Texans embrace.
There is also a long history of Texans modifying their sports cars, from mounting longhorns on car grilles to the annual Houston Art Car Parade, which celebrates the unique and even bizarre ways in which a vehicle can become a rolling work of art.
Texas Minimum Car Insurance Coverage
Much like many other states in the U.S, they also have what is called Texas liability insurance coverage.
But, before we get into what that means, let’s discuss why you need car insurance at all.
According to Nolo, under Texas’s status as a “fault” car accident state, drivers are required to demonstrate their financial responsibility for any crash they might cause.
In layman’s terms, if you cause an accident, you are required to cover the costs of any damages and/or medical bills resulting from that accident. What if you caused a nine-car pile-up? Yep, you’re stuck paying for nine damaged vehicles to be repaired.
Freaked out yet? Don’t be. This is where car insurance comes in to save the day.
We’ve already said that Texas state law requires every driver to carry an auto insurance policy, but did you know your insurance policy must meet Texas state law requirements?
At the very least, ever driver must carry minimum liability insurance. Liability insurance is there to help you cover costs of damages incurred in an accident.
Liability insurance acts as a safety net. If you cause an accident, you’re probably not going to go bankrupt if you carry minimum liability insurance.
However, you could still be stuck paying for damages and medical bills with money from your own pocket; that’s why more insurance coverage is better insurance coverage.
Let’s take a look at Texas minimum liability insurance requirements:
- $30,000 for bodily injury liability per person injured in an accident you cause
- $60,000 for total bodily injury liability when two or more people are injured in an accident you cause
- $25,000 for property damage per accident you cause
Do you think you might need a little more coverage? Stay tuned because additional coverage options are coming up next.
Forms of Financial Responsibility
What is a form of financial responsibility? This term is just a couple of fancy words for proof of insurance. Texas law states that every driver must carry proof of insurance with him or her in a moving vehicle at all times.
Proof of insurance can be shown to a law enforcement officer in any of the following ways:
- Valid liability insurance ID cards
- Copy of your current car’s insurance policy
- Valid insurance binder (a temporary form of car insurance)
- Electronic insurance ID card
- Picture proof of your insurance ID card (can be on your smartphone)
Worried about carrying your ID card on you at all times? Take a screenshot of your insurance card on your cell phone and store it in your photo library.
Any time a police officer asks to see proof of insurance, you must show it to him or her. If you’re caught driving without proof of insurance, you may have to face some serious penalties.
The penalties for driving without proof of car insurance in Texas include:
- suspension of driving privileges
- fines of up to $350 for a first offense and up to $100 for subsequent offenses
- vehicle impoundment for up to 180 days
Keep in mind that current proof of liability insurance is also required to receive or renew motor vehicle registration or vehicle safety inspection. Proof of liability insurance is required only of original driver license applicants.
Premiums as a Percentage of Income
In 2014, Texas’s average annual per capita disposable income was $41,090.00.
But what is a per capita disposable income and what does it have to do with car insurance? Disposable income is the amount of money a person has in their paycheck after taxes have been paid.
In 2014, Texans paid an average of $1,066.20 per year for full coverage car insurance. If the average income the same year was $41,090, this means 2.59% of Texan’s income is spent on car insurance alone!
If Texans are spending just over $1000 on car insurance per year, this means that they are spending an average of $88 monthly.
Countrywide, Americans have an average per capita income of $40,859.00 and pay an average of $981.77 per year on a full coverage car insurance policy.
Texas’s average income is a little higher than the countrywide average, but Texas car insurance is also a little higher than the countrywide average as well.
If you look at the data from surrounding states, New Mexico had a much lower per capita income of $33,358.00 and paid an average of $920.42 per year for car insurance.
Arkansas’s income and car insurance rate for 2014 was about the same as New Mexico’s.
CalculatorPro
Core Car Insurance Coverage in Texas
| Coverage Type | Annual Costs (2015) |
|---|---|
| Liability | $528.75 |
| Collision | $374.49 |
| Comprehensive | $206.42 |
| Combined | $1,109.66 |
The data from the table above is pulled directly from the National Association of Insurance Commissioners.
Keep in mind that the prices for these different types of coverages are probably a little different than they were in the year 2015.
The countrywide average for car insurance is $981.77, so Texans pay a little more than this per year of $1,066.20.
Minimum liability is a great plan to have, but if you really want to make sure you’re never stuck paying out of pocket for damages in the event of a car accident, check out additional coverage options in the sections below.
Additional Liability Coverage in Texas
| Loss Ratio | 2014 | 2013 | 2012 |
|---|---|---|---|
| Personal Injury Protection | 60.73% | 66.3% | 64.35% |
| Medical Payments | 69.55% | 68.78% | 65.76% |
| Uninsured/Underinsured Motorist Coverage | 64% | 61.36% | 53.54% |
The additional coverage types above are all optional liability plans which can be added to any basic insurance policy. Even though drivers aren’t required by law to carry these add-ons, it still might be a great idea to carry them anyway.
But why?
14.1 percent of drivers in Texas are uninsured. Texas is ranked 16th in the U.S. for uninsured/underinsured drivers. Ouch!
If an uninsured driver hits you, damages your vehicle or sends you on a trip to the emergency room, chances are that uninsured drivers will never be able to pay you back for the damages he or she caused. Why?
Repairing vehicles costs a lot of money and uninsured drivers will most likely go bankrupt while attempting to pay these bills.
That’s why it is important to carry uninsured motorist coverage.
But what are loss ratio percentages?
Loss ratio percentages are a way we can measure a companies’ financial strength. If you check out the table above, you will see that the loss ratio percentages from 2012-2014 all fall between 50-100 percent. This is a very good thing.
A loss ratio percentage tells us how many filed claims were paid and how many filed claims went unpaid.
This is important when finding a new insurance company because if the percentage was too high (over 100 percent) the company could be at risk of going bankrupt because they are paying too many claims – some of these claims could be fraudulent.
When you get into an accident, you are required to file a claim with your insurance company. A claim is a report stating all damages that need to be repaired. Claims can also be filed for medical bills.
If the loss ratio percentage is too low (under 50 percent) the car insurance company probably isn’t paying enough claims and might be scamming clients.
In short, when you’re looking for a new insurance company, make sure you stick with a company that has a loss ratio percentage somewhere between 50-100 percent.
Add-ons, Endorsements, and Riders
What other types of insurance can you add to your policy? Every insurance policy should be unique, so the choice is completely up to you.
Click on the links below to learn more about these special add-ons.
- Guaranteed Auto Protection (GAP)
- Personal Umbrella Policy (PUP)
- Rental Reimbursement
- Emergency Roadside Assistance
- Mechanical Breakdown Insurance
- Non-Owner Car Insurance
- Modified Car Insurance Coverage
- Classic Car Insurance
- Pay-As-You-Drive or Usage-Based Insurance
Add one or add them all – just remember you are not required to carry any of these types of insurance.
Male vs. Female Annual Car Insurance Rates in Texas
Did you know factors like gender, marital status and age can affect your car insurance rate?
| Company | Married 35-year old female | Married 35-year old male | Married 60-year old female | Married 60-year old male | Single 17-year old female | Single 17-year old male | Single 25-year old female | Single 25-year old male |
|---|---|---|---|---|---|---|---|---|
| Allstate F&C | $3,564.65 | $3,599.14 | $3,520.01 | $3,520.01 | $9,359.61 | $11,309.20 | $4,410.14 | $4,599.76 |
| The General Automobile Ins Co Inc | $2,918.37 | $3,249.14 | $2,712.68 | $3,109.48 | $7,713.17 | $10,116.84 | $4,191.50 | $4,782.23 |
| Geico County Mutual Ins Co. | $2,433.73 | $2,622.73 | $2,340.42 | $2,649.67 | $5,298.09 | $5,502.21 | $2,632.39 | $2,627.86 |
| Nationwide CCMIC | $2,430.55 | $2,473.88 | $2,146.15 | $2,275.09 | $6,856.66 | $8,817.88 | $2,851.87 | $3,088.49 |
| Progressive Cty Mtl | $2,496.28 | $2,372.24 | $2,219.05 | $2,262.84 | $10,406.29 | $11,607.15 | $2,956.93 | $2,997.99 |
| State Farm Mutual Auto | $2,020.71 | $2,020.71 | $1,797.39 | $1,797.39 | $4,814.71 | $6,130.76 | $2,195.23 | $2,262.71 |
| USAA | $1,594.84 | $1,608.07 | $1,522.66 | $1,516.79 | $4,423.33 | $4,827.05 | $2,125.64 | $2,286.61 |
Unfortunately, men usually end up paying more for car insurance than women do. If you’re married, sometimes car insurance companies will cut you a break – but it’s worse when you’re a minor!
Car insurance companies know inexperienced drivers are more likely to get into a car accident.
As a young person, your rates will be higher until you’re about 25 unless you have a poor driving record. If you keep a clean record, your rates are likely to decrease significantly the older you get.
Read more: The General Auto Insurance Review
Cheapest Rates by Zip Code in Texas
Where you live has a lot to do with your car insurance rate as well.
Find your zip code in the tables below.
| 25 Most Expensive Zip Codes | City | Average by Zip Code | Most Expensive Company | Most Expensive Rate | 2nd Most Expensive Company | 2nd Most Expensive Rate | Cheapest Company | Cheapest Rate | 2nd Cheapest Company | 2nd Cheapest Rate |
|---|---|---|---|---|---|---|---|---|---|---|
| 78049 | LAREDO | $5,538.80 | American Family | $11,340.83 | Progressive | $7,300.88 | USAA | $2,748.03 | State Farm | $3,078.58 |
| 78599 | WESLACO | $5,452.78 | American Family | $11,340.83 | Allstate | $6,223.28 | State Farm | $2,972.86 | USAA | $3,185.94 |
| 77036 | HOUSTON | $5,430.22 | American Family | $9,058.31 | Allstate | $7,237.52 | USAA | $3,028.85 | State Farm | $3,600.90 |
| 77033 | HOUSTON | $5,271.84 | American Family | $8,080.72 | Allstate | $7,297.35 | USAA | $3,021.85 | State Farm | $3,649.74 |
| 77072 | HOUSTON | $5,247.11 | American Family | $9,024.11 | Allstate | $6,217.03 | USAA | $3,028.85 | State Farm | $3,485.64 |
| 75207 | DALLAS | $5,225.75 | Allstate | $7,664.33 | Progressive | $7,367.34 | USAA | $2,935.83 | State Farm | $3,620.92 |
| 77053 | HOUSTON | $5,188.07 | American Family | $8,091.63 | Allstate | $7,155.33 | USAA | $3,035.35 | State Farm | $3,538.37 |
| 77060 | HOUSTON | $5,173.49 | American Family | $7,251.55 | Allstate | $6,756.97 | USAA | $3,031.86 | State Farm | $3,941.98 |
| 77067 | HOUSTON | $5,166.35 | American Family | $7,397.64 | Allstate | $7,135.70 | USAA | $3,031.86 | State Farm | $3,965.58 |
| 77076 | HOUSTON | $5,164.01 | Allstate | $7,297.35 | American Family | $6,965.79 | USAA | $3,007.16 | State Farm | $3,863.19 |
| 77091 | HOUSTON | $5,162.46 | Allstate | $7,297.35 | American Family | $6,976.94 | USAA | $3,155.30 | State Farm | $3,768.48 |
| 77078 | HOUSTON | $5,154.98 | Allstate | $7,352.64 | American Family | $7,217.59 | USAA | $3,158.70 | State Farm | $3,763.05 |
| 75242 | DALLAS | $5,150.98 | Allstate | $7,822.46 | Progressive | $7,730.91 | USAA | $3,035.63 | Geico | $3,508.43 |
| 79430 | LUBBOCK | $5,143.23 | American Family | $11,340.83 | Progressive | $7,300.88 | USAA | $2,679.39 | State Farm | $2,898.28 |
| 77037 | HOUSTON | $5,141.92 | Allstate | $7,292.85 | American Family | $6,534.37 | USAA | $3,031.86 | State Farm | $3,803.26 |
| 77022 | HOUSTON | $5,115.43 | Allstate | $7,297.35 | American Family | $6,978.54 | USAA | $3,007.16 | State Farm | $3,906.52 |
| 77039 | HOUSTON | $5,115.40 | American Family | $7,325.25 | Allstate | $6,770.35 | USAA | $3,007.16 | State Farm | $3,857.41 |
| 77081 | HOUSTON | $5,113.05 | American Family | $7,787.38 | Allstate | $7,121.41 | USAA | $3,179.07 | State Farm | $3,384.26 |
| 77088 | HOUSTON | $5,111.68 | American Family | $8,232.62 | Allstate | $6,585.55 | USAA | $3,155.30 | State Farm | $3,823.85 |
| 77016 | HOUSTON | $5,108.01 | Allstate | $7,352.64 | American Family | $6,981.03 | USAA | $3,007.16 | State Farm | $3,777.08 |
| 77028 | HOUSTON | $5,107.10 | Allstate | $7,664.33 | American Family | $6,909.53 | USAA | $3,158.70 | State Farm | $3,494.20 |
| 77093 | HOUSTON | $5,104.27 | Allstate | $7,286.61 | American Family | $6,716.86 | USAA | $3,158.70 | State Farm | $3,838.99 |
| 77026 | HOUSTON | $5,098.02 | Allstate | $7,352.64 | American Family | $7,017.25 | USAA | $3,158.70 | State Farm | $4,012.27 |
| 77050 | HOUSTON | $5,097.68 | Allstate | $7,306.24 | American Family | $6,677.08 | USAA | $3,007.16 | State Farm | $3,762.08 |
| 75210 | DALLAS | $5,095.76 | Allstate | $7,664.33 | American Family | $7,286.10 | USAA | $3,025.08 | State Farm | $3,565.59 |
A number of the most expensive zip codes are in Houston.
| 25 Least Expensive Zip Codes | City | Average by Zip Codes | Most Expensive Company | Most Expensive Rate | 2nd Most Expensive Company | 2nd Most Expensive Rate | Cheapest Company | Cheapest Rate | 2nd Cheapest Company | 2nd Cheapest Rate |
|---|---|---|---|---|---|---|---|---|---|---|
| 76901 | SAN ANGELO | $3,157.68 | Allstate | $4,542.85 | American Family | $3,786.57 | USAA | $2,191.07 | State Farm | $2,428.78 |
| 76904 | SAN ANGELO | $3,158.56 | Allstate | $4,542.85 | Progressive | $3,809.41 | USAA | $2,074.47 | State Farm | $2,401.91 |
| 76939 | KNICKERBOCKER | $3,209.72 | Allstate | $4,542.85 | American Family | $3,866.31 | USAA | $2,086.49 | State Farm | $2,422.19 |
| 76306 | WICHITA FALLS | $3,210.65 | Allstate | $4,736.95 | American Family | $3,838.60 | USAA | $1,891.48 | State Farm | $2,518.20 |
| 76909 | SAN ANGELO | $3,224.21 | Allstate | $4,542.85 | Progressive | $3,954.71 | USAA | $2,074.47 | State Farm | $2,422.19 |
| 76502 | TEMPLE | $3,260.31 | Allstate | $4,841.18 | American Family | $3,890.07 | USAA | $2,228.61 | Geico | $2,679.10 |
| 76886 | VERIBEST | $3,267.18 | Allstate | $4,926.00 | American Family | $3,815.43 | USAA | $2,191.07 | State Farm | $2,422.19 |
| 76798 | WACO | $3,267.20 | Allstate | $5,137.52 | Progressive | $3,902.02 | Nationwide | $2,326.70 | USAA | $2,345.00 |
| 76712 | WOODWAY | $3,268.96 | Allstate | $5,153.61 | Progressive | $4,103.39 | Nationwide | $2,245.76 | USAA | $2,276.47 |
| 76908 | GOODFELLOW AFB | $3,281.51 | Allstate | $4,542.85 | American Family | $3,972.20 | USAA | $2,074.47 | State Farm | $2,437.99 |
| 75110 | CORSICANA | $3,285.30 | Allstate | $4,920.59 | Progressive | $3,748.30 | USAA | $2,189.79 | Geico | $2,551.76 |
| 76354 | BURKBURNETT | $3,293.59 | Allstate | $4,898.60 | American Family | $3,869.85 | USAA | $2,065.82 | State Farm | $2,533.62 |
| 76543 | KILLEEN | $3,306.33 | Allstate | $4,929.48 | American Family | $4,125.00 | USAA | $2,227.94 | State Farm | $2,673.85 |
| 76309 | WICHITA FALLS | $3,315.43 | Allstate | $4,816.42 | American Family | $4,292.15 | USAA | $2,065.82 | Geico | $2,530.78 |
| 76706 | WACO | $3,320.96 | Allstate | $5,137.52 | American Family | $4,044.42 | Nationwide | $2,326.70 | USAA | $2,345.00 |
| 76905 | SAN ANGELO | $3,322.35 | Allstate | $4,926.00 | Progressive | $4,180.44 | USAA | $2,091.54 | State Farm | $2,389.41 |
| 76903 | SAN ANGELO | $3,331.83 | Allstate | $4,799.16 | American Family | $4,047.69 | USAA | $2,187.37 | State Farm | $2,424.89 |
| 76957 | WALL | $3,332.11 | Allstate | $4,542.85 | Progressive | $3,999.84 | USAA | $2,191.07 | State Farm | $2,422.19 |
| 76513 | BELTON | $3,334.52 | Allstate | $5,137.52 | American Family | $3,792.42 | USAA | $2,184.73 | State Farm | $2,632.49 |
| 76564 | PENDLETON | $3,336.13 | Allstate | $5,114.28 | American Family | $3,910.53 | USAA | $2,199.69 | State Farm | $2,658.77 |
| 76710 | WACO | $3,337.22 | Allstate | $5,128.65 | American Family | $3,865.74 | USAA | $2,276.47 | Geico | $2,681.32 |
| 76711 | WACO | $3,347.58 | Allstate | $5,153.61 | Progressive | $3,857.42 | USAA | $2,276.47 | Geico | $2,690.25 |
| 77881 | WELLBORN | $3,347.60 | Allstate | $4,860.77 | Progressive | $3,942.06 | USAA | $2,198.68 | State Farm | $2,671.94 |
| 76311 | SHEPPARD AFB | $3,351.07 | Allstate | $4,975.86 | American Family | $4,243.10 | USAA | $1,891.48 | Geico | $2,530.78 |
| 76310 | WICHITA FALLS | $3,351.57 | Allstate | $4,952.60 | American Family | $4,289.31 | USAA | $2,065.82 | State Farm | $2,480.04 |
The cheapest zip code is in San Angelo.
Cheapest Rates by Cities in Texas
Find the cheapest rate by city in the tables below.
| Top 10 Most Expensive Cities | Average by City | Most Expensive Company | Most Expensive Rate | 2nd Most Expensive Company | 2nd Most Expensive Rate | Cheapest Company | Cheapest Rate | 2nd Cheapest Company | 2nd Cheapest Rate |
|---|---|---|---|---|---|---|---|---|---|
| Weslaco | $5,452.78 | American Family | $11,340.83 | Allstate | $6,223.28 | State Farm | $2,972.86 | USAA | $3,185.94 |
| Texhoma | $5,290.29 | American Family | $11,340.83 | Progressive | $7,937.62 | USAA | $2,417.11 | State Farm | $2,464.41 |
| Aldine | $5,143.60 | American Family | $7,037.06 | Allstate | $6,940.06 | USAA | $3,023.62 | State Farm | $3,867.55 |
| Cockrell Hill | $4,805.29 | Allstate | $6,750.75 | American Family | $6,361.56 | USAA | $2,898.46 | State Farm | $3,728.37 |
| North Houston | $4,799.60 | Progressive | $7,300.88 | Allstate | $6,438.51 | USAA | $2,760.28 | State Farm | $3,348.79 |
| Houston | $4,770.73 | American Family | $6,846.57 | Allstate | $6,514.79 | USAA | $2,931.67 | State Farm | $3,466.09 |
| Garciasville | $4,762.95 | Progressive | $7,172.16 | Allstate | $6,903.43 | State Farm | $2,719.54 | USAA | $2,891.85 |
| South Houston | $4,748.61 | Allstate | $6,493.81 | American Family | $6,132.67 | USAA | $3,023.90 | State Farm | $3,338.51 |
| Galena Park | $4,739.02 | Allstate | $6,493.81 | American Family | $6,255.89 | USAA | $3,163.52 | State Farm | $3,389.03 |
| Linn | $4,726.10 | Progressive | $6,965.34 | Allstate | $6,148.71 | State Farm | $3,080.73 | USAA | $3,185.94 |
The city of Weslaco comes in first place for the city with the most expensive car insurance: over $5,000 per year.
| Top 10 Least Expensive Cities | Average by City | Most Expensive Company | Most Expensive Rate | 2nd Most Expensive Company | 2nd Most Expensive Rate | Cheapest Company | Cheapest Rate | 2nd Cheapest Company | 2nd Cheapest Rate |
|---|---|---|---|---|---|---|---|---|---|
| Grape Creek | $3,157.68 | Allstate | $4,542.85 | American Family | $3,786.57 | USAA | $2,191.07 | State Farm | $2,428.78 |
| Knickerbocker | $3,209.72 | Allstate | $4,542.85 | American Family | $3,866.31 | USAA | $2,086.49 | State Farm | $2,422.19 |
| San Angelo | $3,259.24 | Allstate | $4,702.71 | Progressive | $3,992.96 | USAA | $2,106.96 | State Farm | $2,409.60 |
| Veribest | $3,267.18 | Allstate | $4,926.00 | American Family | $3,815.43 | USAA | $2,191.07 | State Farm | $2,422.19 |
| Goodfellow AFB | $3,281.51 | Allstate | $4,542.85 | American Family | $3,972.20 | USAA | $2,074.47 | State Farm | $2,437.99 |
| Burkburnett | $3,293.59 | Allstate | $4,898.60 | American Family | $3,869.85 | USAA | $2,065.82 | State Farm | $2,533.62 |
| Robinson | $3,320.96 | Allstate | $5,137.52 | American Family | $4,044.42 | Nationwide | $2,326.70 | USAA | $2,345.00 |
| Wall | $3,332.11 | Allstate | $4,542.85 | Progressive | $3,999.84 | USAA | $2,191.07 | State Farm | $2,422.19 |
| Belton | $3,334.52 | Allstate | $5,137.52 | American Family | $3,792.42 | USAA | $2,184.73 | State Farm | $2,632.49 |
| Pendleton | $3,336.13 | Allstate | $5,114.28 | American Family | $3,910.53 | USAA | $2,199.69 | State Farm | $2,658.77 |
Grape Creek has the least expensive zip code.
Affordable Insurance Options Across Texas Cities
Explore the most cost-effective insurance choices in various Texas cities, including Arlington, Fort Worth, Lubbock, Corpus Christi, Garland, Plano, Dallas, Houston, San Antonio, El Paso, and Irving. This guide helps you navigate through the cheapest insurance providers to secure your needs efficiently and economically.
| Find the Cheapest Insurance in Your City | ||
|---|---|---|
| Arlington, TX | Fort Worth, TX | Lubbock, Texas |
| Corpus Christi, TX | Garland, Texas | Plano, TX |
| Dallas, Texas | Houston, Texas | San Antonio, Texas |
| El Paso, TX | Irving, Texas |
Enter your ZIP code below to compare auto insurance rates.
![]() Secured with SHA-256 Encryption
Secured with SHA-256 Encryption
Best Texas Car Insurance Companies
With literally hundreds of car insurance companies out there, it can be difficult to choose just one to trust with your money and your peace of mind.
No one has time to dig through hundreds of car insurance reviews; that’s why we wanted to include this next section about the best car insurance companies in our guide.
Below, we will talk about AM best ratings, customer service satisfaction, company complaints, and more. We’ve partnered with the NAIC and J.D. Power to serve you better with the following information.
Ratings of the 10 Largest Car Insurance Companies in Texas
| Company | AM Best Rating | Direct Premiums Written | Loss Ratio | Market Share |
|---|---|---|---|---|
| State Farm Group | A++ | $3,563,120 | 78.29% | 16.83% |
| Geico | A++ | $2,637,489 | 88.18% | 12.46% |
| Allstate Insurance Group | A+ | $2,362,584 | 66.19% | 11.16% |
| Progressive Group | A+ | $2,041,345 | 68.91% | 9.64% |
| Farmers Insurance Group | NR | $1,842,735 | 66.07% | 8.70% |
| USAA Group | A++ | $1,712,949 | 88.30% | 8.09% |
| Liberty Mutual Group | A | $1,195,735 | 83.96% | 5.65% |
| Texas Farm Bureau Mutual Group | A- | $693,004 | 77.31% | 3.27% |
| Consumers County Mutual Insurance Co | NR | $541,825 | 86.45% | 2.56% |
| Nationwide Corp Group | A+ | $473,342 | 65.53% | 2.24% |
What are AM Best Ratings?
AM Best Ratings are how we measure a company’s financial strength. We can also measure a company’s strength by loss ratio percentages.
All of the companies listed above show AM Best Ratings of an A rating or higher. They also all have great loss ratio percentages.
Texas Car Insurance Companies with the Best Ratings
When you’re standing on the side of the road after you’ve just gotten into a car accident, the last thing you want to hear on the phone from your insurance company is a nasty voice.
Customer satisfaction might be one of the most important things when it comes to picking a new car insurance company. Is the person I’m speaking with friendly on the other end of the line? Are they compassionate?
The information below is brought to you by J.D. Power.
The 2019 U.S. Auto Insurance Study, now in its 20th year, examines customer satisfaction in five factors (in order of importance): interaction; policy offerings; price; billing process and policy information; and claims.
The study is based on responses from 42,759 auto insurance customers and was fielded from February through April 2019.
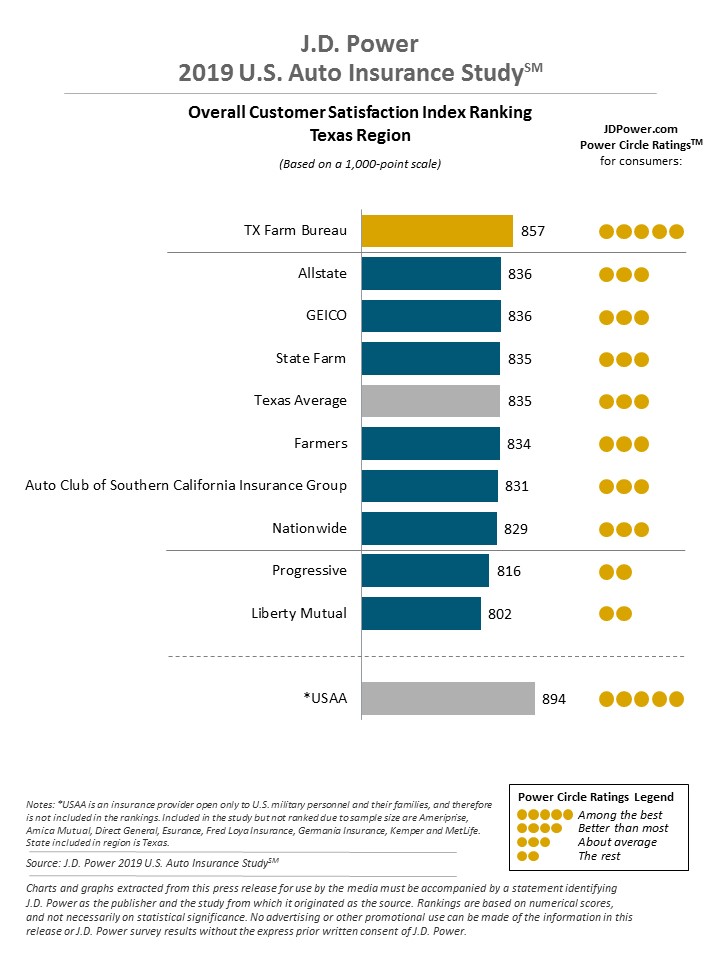
With the exception of USAA (a company that only serves military members and their families), Texas Farm Bureau Insurance was ranked number one for customer satisfaction in 2019.
Companies with the Most Complaints in Texas
Every company receives complaints. How a company handles a complaint is what really makes all the difference, especially when it comes to customer satisfaction.
The data below is collected from the NAIC.
| Company | National Median Complaint Ratio | Company Complaint Ratio 2017 | Total Complaints 2017 |
|---|---|---|---|
| State Farm Group | 1 | 0.44 | 1482 |
| Geico | 0.007 | 6 | |
| Allstate Insurance Group | 1 | 0.5 | 163 |
| Progressive Group | 1 | 0.75 | 120 |
| Farmers Insurance Group | 1 | 0.59 | 7 |
| USAA Group | 0 | 2 | |
| Liberty Mutual Group | 1 | 5.95 | 222 |
| Texas Farm Bureau Mutual Group | 1 | 0.16 | 3 |
| Consumers County Mutual Insurance Co | 1 | 0.1 | 5 |
| Nationwide Corp Group | 1 | 0.28 | 25 |
You shouldn’t avoid a company just because of a couple of complaints. Look at Geico for instance. Geico is rated as one of the best insurance companies in the world and still, there were complaints against them.
Cheapest Car Insurance Companies in Texas
| Companies | Average Annual Auto Insurance Rates | Compared to State Average Auto Insurance Rates | Percentage Difference Compared to State Average |
|---|---|---|---|
| USAA | $2,488.12 | -$1,440.22 | -57.88% |
| State Farm Mutual Auto | $2,879.95 | -$1,048.39 | -36.40% |
| Geico County Mutual Ins Co. | $3,263.39 | -$664.95 | -20.38% |
| Nationwide CCMIC | $3,867.57 | -$60.77 | -1.57% |
| Progressive Cty Mtl | $4,664.85 | $736.51 | 15.79% |
| The Gen Automobile Ins Co Inc | $4,849.18 | $920.84 | 18.99% |
| Allstate F&C | $5,485.32 | $1,556.98 | 28.38% |
According to the data above, State Farm Mutual Auto and USAA have the cheapest car insurance rates in Texas.
Commute Rates by Companies in Texas
Did you know that how far you drive every day can also affect your rate?
| Group | 10 miles commute, 6000 annual mileage | 25 miles commute, 12000 annual mileage |
|---|---|---|
| Allstate | $5,354.10 | $5,616.53 |
| American Family | $4,849.18 | $4,849.18 |
| Geico | $3,201.27 | $3,325.50 |
| Nationwide | $3,867.57 | $3,867.57 |
| Progressive | $4,664.85 | $4,664.85 |
| State Farm | $2,879.95 | $2,879.95 |
| USAA | $2,456.42 | $2,519.83 |
With the exception of USAA and Allstate, most rates are the same even if you drive a total of 10 miles per day or 25.
Coverage Level Rates by Companies in Texas
Worried about paying too much for car insurance? Sometimes, insurance providers will give you a break on your rate if you have more insurance than what is required by the law.
| Company | Low Coverage | Medium Coverage | High Coverage |
|---|---|---|---|
| Allstate | $5,361.24 | $5,438.89 | $5,655.81 |
| American Family | $4,517.27 | $4,672.73 | $5,357.52 |
| Geico | $3,090.73 | $3,221.75 | $3,477.68 |
| Nationwide | $4,165.19 | $3,701.00 | $3,736.52 |
| Progressive | $4,431.31 | $4,642.33 | $4,920.90 |
| State Farm | $2,729.50 | $2,870.49 | $3,039.86 |
| USAA | $2,403.46 | $2,477.96 | $2,582.94 |
Credit History Rates by Companies in Texas
Do you have a bad credit score? If so, chances are you might be spending a lot more green than you need to on your car insurance policy.
| Group | Good Credit History | Fair Credit History | Poor Credit History |
|---|---|---|---|
| Allstate | $4,370.89 | $5,107.95 | $6,977.11 |
| American Family | $3,672.27 | $4,205.41 | $6,669.84 |
| Geico | $1,902.16 | $2,851.60 | $5,036.40 |
| Nationwide | $3,235.20 | $3,722.88 | $4,644.64 |
| Progressive | $4,201.38 | $4,536.59 | $5,256.57 |
| State Farm | $2,023.50 | $2,538.85 | $4,077.51 |
| USAA | $1,696.02 | $2,109.52 | $3,658.82 |
According to Experian, the average credit score in the state of Texas in 2017 was 656. This score put Texas on the list of the top ten states with the lowest credit scores.
The average American countrywide has an average credit score of 675, so Texas falls behind this score by 19 points.
A poor credit score can cost you thousands of dollars more per year when it comes to your car insurance rate.
According to the data above, Geico has the most drastic rate change – your rate could increase to about $4,000 per year if you lose your good credit score. Ouch!
Driving Record Rates by Companies in Texas
We’re not going to say car insurance companies don’t use rates as punishments, but we actually are going to say car insurance companies use rates as a way to help drivers be better, more responsible drivers.
Does that make sense?
Take a look at the table below. If you get just one speeding ticket, your car insurance rate could increase by up to $400 a year.
| Group | Clean record | With 1 speeding violation | With 1 accident | With 1 DUI |
|---|---|---|---|---|
| Allstate | $4,270.52 | $4,270.52 | $6,562.28 | $6,837.95 |
| American Family | $4,418.84 | $4,418.84 | $5,627.66 | $4,931.37 |
| Geico | $2,769.60 | $3,570.55 | $3,651.43 | $3,061.96 |
| Nationwide | $3,351.99 | $3,789.11 | $3,351.99 | $4,977.19 |
| Progressive | $4,066.74 | $4,581.27 | $5,258.36 | $4,753.00 |
| State Farm | $2,561.35 | $2,561.35 | $2,934.63 | $3,462.47 |
| USAA | $1,858.11 | $2,132.96 | $2,737.39 | $3,224.03 |
On the other hand, if you keep a clean record, car insurance companies will reward you for being a good driver. It’s called a “good driver discount.”
https://www.youtube.com/watch?v=yMsmubcvY_k
Number of Insurers in Texas
What’s the difference between foreign and domestics insurers?
| Domestic | Foreign | Total Number of Licensed Insurers |
|---|---|---|
| 199 | 937 | 1136 |
Domestic insurance laws are formed under the state laws of Texas, while foreign insurance laws are formed under the federal laws of the U.S.
Why do you care? Up next we discuss how insurance laws are formed, why they are important to know and much more.
Texas State Laws
Do you know every single state driving law ever formed?
Here’s a hint: it’s okay if you don’t know all of them. That’s exactly why we wanted to write this next section.
With so many state laws, it’s difficult to know every single one of them. Not knowing these laws could put you in jail, or worse, cause you to get into a car accident.
The “I didn’t know, Officer,” excuse isn’t going to cut it (most of the time).
To keep your car insurance rate affordable, you might want to pay attention to this next section on Texas state laws.
The following information is brought to you by the NAIC, the IIHS, responsibility.org, and carwindshields.info.
Car Insurance Laws in Texas
Have you ever wondered how statewide car insurance laws are determined?
According to the NAIC, state laws have considerable influence on auto insurance.
Each state determines the type of tort law and threshold (if any) that applies in the state, the type and amount of liability insurance required, and the system used for approval of insurer rates and forms.
In addition, the states have enacted varying auto seat belt requirements, drunk driving laws, and maximum speed limits.
But how are car insurance laws formed in Texas?
The states employ a variety of rate regulation mechanisms. Options include: 1) determined by Commissioner; 2) prior approval; 3) modified prior approval; 4) flex rating; 5) file and use; 6) use and file; and 7) no file.
Texas uses two processes: prior approval and by regulating policy forms as needed according to Chapter 2301 (Art. 5.145 & Sect. 8, Art. 5.13-2, TX INS CODE).
Prior Approval: Rates/forms must be filed with and approved by the state insurance department before they can be used. Approval can be by means of a deemer provision, which indicates approval if rates/forms are not denied within a specified number of days.
Why do you care about how these laws are formed? Have you ever needed your windshield replaced?
You guessed it. The state decides important laws like these which could save you money in the long run.
Windshield Coverage
Unfortunately, there aren’t any laws regarding windshield repair in Texas at this time.
However, individual insurance companies may offer windshield repair coverage with a comprehensive insurance plan.
High-Risk Insurance
Have you ever been in an accident and needed to get high-risk insurance or SR22 insurance?
According to the Texas Department of Public Safety, a Financial Responsibility Insurance Certificate (SR-22) is required by the Texas Transportation Code Chapter 601 to verify that you are maintaining motor vehicle liability insurance.
An SR-22 can be issued by most insurance providers and certifies that you have the minimum liability insurance as required by law.
An insurance provider will automatically notify the Department when an SR-22 is canceled, terminated or lapses.
Here are some reasons you may need to get SR-22 insurance:
- Conviction of DUI/DWI
- Driving while uninsured
- A traffic violation that results in a fatality or serious injury
- A high number of points on your driving record
- A high-risk car (sports cars, etc.)
You should contact your local insurance agent or provider to obtain an SR-22. If you do not own a vehicle, you should ask an insurance provider about a Texas Non-Owner SR-22 Insurance policy.
Low Income Government Aided Car Insurance
Unless you live in California, Hawaii, or New Jersey, you’re not getting any government aid to help you pay for your car insurance.
Discouraged? Are you looking for more ways to save? Ask your provider if you qualify for any of the following discounts:
- Safe driver discount
- Military discount
- Homeowner’s discount
- Student discount
- Multi-car discount
Are you ready to start comparing rates right now? Enter your zip code in the box below to see how you can save 50 percent or more on your car insurance policy.
Free Auto Insurance Comparison
Enter your ZIP code below to compare auto insurance rates.
![]() Secured with SHA-256 Encryption
Secured with SHA-256 Encryption
Automobile Insurance Fraud in Texas
What is automobile insurance fraud?
According to the III, Insurance fraud can be “hard” or “soft.” Hard fraud occurs when someone deliberately fabricates claims or fakes an accident.
Soft insurance fraud, also known as opportunistic fraud, occurs when people pad legitimate claims, for example, or, in the case of business owners, list fewer employees or misrepresent the work they do to pay lower premiums for worker’s compensation.
Check out this comical video below – it shows people faking accidents.
https://www.youtube.com/watch?v=09MK6qLPWOg
Are you worried about accidentally committing insurance fraud? Don’t pad your claims and don’t fake an accident.
The III also says that the Insurance Research Council reported that “Auto insurance fraud and claim buildup added between $4.9 billion and $6.8 billion to closed auto injury claim payments in 2007.”
If you or someone you know has committed insurance fraud and you’d like to report it, or you need assistance with an insurance claim, please contact the Texas State Department of Insurance at 512-676-6000 or visit their office located at the address listed below.
333 Guadalupe Austin, TX 78701
Statute of Limitations in Texas
The statute of limitations law prevents drivers from cheating the system by filing insurance claims many years after being in an accident.
The statute of limitations law also protects the driver by allowing claims to be filed within a certain amount of time.
Here’s what we mean: in the state of Texas, you have just two years from the day you get into an accident to file an insurance claim for both property damage and personal injury.
Two years goes by fast, so if you’ve been in a recent accident, don’t sit around and wait to file a claim.
Texas State Specific Laws
Here’s a fun little section sure to make you laugh.
Texas has seven weird state-specific driving laws.
- All vehicles must have windshield wipers – even if the vehicle doesn’t have a windshield.
- Anything protruding from a car bumper must be attached with a chain.
- In Lubbock, Texas, individuals cannot drive within an arm’s length of alcohol. This includes alcohol in someone else’s body and/or bloodstream.
- In Texarcana, horseriders must have taillights on their horses while riding at night.
- In Denton County in Fort Worth, you must set your parking brake every time you get out of your car.
- In Richardson, it’s illegal to make a U-turn.
- In Galveston, it’s illegal to drive down Broadway before noon on Sundays.
Vehicle Licensing Laws
Have you ever heard of a REAL ID?
After October 1st, 2020, individuals will need to show a REAL ID to get through airport security – even when traveling on domestics flights.
Does your license have a gold star in the top right-hand corner?
Penalties for Driving Without Insurance
The information below is brought to you by the Texas Department of Public Safety and the Transportation Code, Title 7.
Driving without car insurance in Texas is against the law. Check out the table below for penalties for drivers who choose to drive without insurance.
| Penalties for Driving Without Insurance in Texas | Details |
|---|---|
| First Offense | - Fine: $175 to $350 fine - pay up to a $250 surcharge every year for three years (may be reduced with certain requirements) |
| Second Offense | - Fine: $350 to $1000 - pay up to a $250 surcharge every year for three years (may be reduced with certain requirements) - suspend the driver's license and vehicle registrations of the person unless the person files and maintains evidence of financial responsibility with the department until the second anniversary of the date of the subsequent conviction - Impoundment: for 180 days and cannot apply for release of car without evidence of financial responsibility and impoundment fee of $15/day |
When a law enforcement officer asks for your proof of insurance and registration, you must show it to him or her. In case you forgot, let’s go over acceptable forms of proof of insurance.
- Valid liability insurance ID cards
- Copy of your current car’s insurance policy
- Valid insurance binder (a temporary form of car insurance)
- Picture of proof of insurance on your smartphone
- Electronic proof of insurance
If you’re caught driving without insurance, you could have your license taken away.
Teen Driver Laws in Texas
In Texas, people who are 15 or older but under 18 must satisfactorily complete and pass the classroom phase of an approved driver education course to be issued a permit.
Check out these teen driving laws in the table below.
| Requirements for Getting a License in Texas | Details |
|---|---|
| Mandatory Holding Period | 6 months |
| Minimum Supervised Driving Time | 30 hours, 10 of which must be at night |
| Minimum Age | 16 years old (the minimum license age is 18 for applicants who have not completed driver education) |
If you have a restricted license in Texas, you must follow these laws listed below.
| Restricted License Laws in Texas | Details |
|---|---|
| Nighttime restrictions | midnight-5 a.m. |
| Passenger restrictions (family members excepted unless noted otherwise) | no more than 1 passenger younger than 21 secondary enforcement |
| Minimum age at which restrictions may be lifted | |
| Nighttime restrictions | until age 18 |
| Passenger restrictions | until age 18 |
Driver License Renewal Procedures
Texas state law requires every driver to renew their license. However, this law is different for drivers based on age.
If you are under the age of 85, you must renew your license every eight years. If you are 85 years old or older you must renew your license every two years.
Proof of adequate vision is required at every renewal if you are 79 years old or older. If you are younger than 79, you must show proof of adequate vision if you are renewing your license in person.
You may renew your license online or by mail if:
- You are under the age of 79
- You may renew your license online or by mail every other time
The info above is collected from the IIHS.
New Residents in Texas
Are you a new resident in the state of Texas? Thinking about moving to the Lone Star State any time soon?
You have 30 days from the time you move to register your vehicle in the state of Texas.
In Texas, you must show you have insurance coverage for a minimum of $30,000 per injured person, up to a total of $60,000 for everyone injured in an accident, and $25,000 for property damage.
Be sure to let your insurance company you are moving so they can set you up with the right insurance policy. Keep in mind that some companies do not provide insurance in certain states.
Negligent Operator Treatment System (NOTS)
According to Texas Car Laws, unlike a simple speeding ticket, “negligent” or reckless driving is a more serious offense. Under the Texas Transportation Code, you can be charged with a misdemeanor.
Getting convicted means it will go into your permanent record and shows up on criminal background checks, which can make getting employment difficult.
Reckless driving in Texas carries significantly lower penalties than in most other states. Each reckless driving conviction in TX will result in a fine of $200 or less, or imprisonment in county jail for up to 30 days, or both.
There may be additional surcharges or court and lawyer costs involved, depending on each case. Reckless driving typically comes paired with other charges such as speeding or street racing.
In case of death or injury to persons or damage to property, it can come with felony charges, especially if the violation is classified as a hit and run.
In addition to fines, two points will be added against your driver’s license record, or three if involved in an accident. Your license will furthermore be automatically suspended for 30 days.
Rules of the Road
This next section will cover Texas’s rules of the road. We’ll talk about seat belt and car seat laws, speed limit laws, ridesharing insurance laws, and more.
Fault vs. No-Fault
As we previously discussed, Texas is an at-fault car accident state. If you cause an accident, you are held responsible to cover the costs of damages resulting from that accident.
The at-fault driver will also need to cover all medical bills of anyone needing medical intervention caused by the accident.
It’s always a good idea to have more insurance than the minimum amount required when you live in an at-fault state.
Read more: Fault vs. No Fault Auto Insurance Laws
Seat Belt and Car Seat Laws
The information below is collected from the IIHS.
Are you aware of Texas’s seat belt laws? Take a look at the table below for more information.
| Safety Belt Laws in Texas | Details |
|---|---|
| Effective Since | September 1, 1985 |
| Primary Enforcement | yes; effective 09/01/85 |
| Age/Seats Applicable | 7 years and younger who are 57 inches or taller; 8+ years in all seats |
| 1st Offense Max Fine | $200 |
Texas also wants children to be safe while on the road. Help keep your babies safe by making sure you know these car seat laws.
| Type of Car Seat Required | Age |
|---|---|
| Must be in child safety seat | 7 years and younger and less than 57 inches |
| Preference for rear seat | law states no preference for rear seat |
| Adult Belt Permissible | not permissible |
| Maximum base fine 1st offense, additional fees may apply | $25 minimum; maximum unlisted |
If you are caught breaking these car seat laws just once, you could have to pay a fine of $45 plus fees.
It is illegal to ride in the cargo area of a pick-up truck in Texas.
If you are riding in the back of a pick-up truck and the truck is involved in an accident, your insurance may not cover you if the following applies:
- people 18 and older
- vehicles that are the only vehicles owned by members of the household
- vehicles in parades, hayrides, or on beaches
- vehicles in farm operations used to transport people from field to field or on a farm
- a vehicle being used in an emergency
Keep Right and Move Over Laws
The Texas Keep Right or Move Over Law is pretty self-explanatory.
Keep right if you are driving slower than the average speed of traffic around you. Use the left lane for passing.
Passing on the right is allowed on one-way roads or during other conditions.
The AAA says state law requires drivers approaching a stationary authorized emergency vehicle, including a tow truck and Texas DMV vehicles and workers, using approved visual signals, and traveling in the same direction, to reduce speed and vacate the lane closest to the emergency vehicles.
Speed Limit Laws in Texas
Below is a table showing Texas speed limits on various roads.
| Type of Roadway | Speed Limit |
|---|---|
| Rural Interstates | 75; 80 or 85 on specified segments of road |
| Urban Interstates | 75 mph |
| Other Limited Access Roads | 75 mph |
| Other Roads | 75 mph |
Sections of I-10 and I-20 in West Texas and sections of Highway 45 in Travis County have a speed limit for passenger cars and light trucks of 80 mph.
Speed limits of up to 85 mph may be established if the highway is originally constructed and designed to accommodate the higher speed and it has been determined by an engineering study to be reasonable and safe.
State Highway 130 (portions toll) has a posted limit of 85 mph.
Keep in mind that the speed limit laws listed are the maximum limits allowed in the state of Texas.
Ridesharing Laws in Texas
Have you ever heard of ridesharing services like Uber or Lyft? If you work for companies like these, you must have ridesharing insurance.
You can find this kind of insurance at any one of the following providers:
- Allstate
- Farmers
- Geico
- Liberty Mutual
- Metlife
- Progressive
- USAA
Remember that some insurance companies may choose to refuse to insure you if you need ridesharing insurance.
Automation on the Road
What is automation on the road?
According to the IIHS, in driving, automation involves using radar, camera, and other sensors to perform parts or all of the driving tasks on a sustained basis instead of the driver.
One example is adaptive cruise control, which continually adjusts the vehicle’s speed to maintain a set minimum following distance.
Features such as automatic braking, which acts as a back-up if the human driver fails to brake, or blind-spot detection, which provides additional information to the driver, aren’t considered automation under this definition.
| What type of driving automation on public roads does the law/provision permit? | Require an operator to be licensed? | Require an operator to be in the vehicle? | Require liability insurance? |
|---|---|---|---|
| Deployment | No | No | Yes |
Driving automation is not limited to vehicles that drive themselves without human interaction but includes technologies that vary in technical capability.
Safety Laws
If you don’t know Texas’s safety laws, this next section is for you. We want to make sure you know laws about DUIs, drugged-driving, distracted driving, and more.
Pay attention and buckle up because this next section in our handy dandy insurance guide could save your life.
DUI Laws
From 2008-2017, over 13,000 people were killed as a result of alcohol-impaired driving. In the state of Texas, driving drunk has strict consequences.
| DUI Laws in Texas | Details |
|---|---|
| Name for Offense | Driving under the influence (DUI) |
| BAC Limit | 0.08 |
| High BAC Limit | 0.15 |
| Criminal Status | 1st class B misdemeanor, 2nd in 5 years class A misdemeanor, 3rd+ third degree feonies |
| Look Back Period | unlimited/lifetime for sentencing; 5 years for 2nd+ when determining need for IID |
Below, you’ll see the penalities for drunk-driving.
| Number of Offense | ALS or Revocation | Imprisonment | Fine | Other |
|---|---|---|---|---|
| 1st Offense | 90 days - 1 year, may be eligible for harship permit | 72 hours - 6 months | no minimum, but up to $2000 +conviction based surcharge of $1000 for three consecutive years; if HBAC, surcharge is $1500 for three consecutive years | 24-100 hours community service; required evaluation, DUI education, and victim impact panel; possible IID |
| 2nds Offense | 180 days - 2 years, may eb elegible for hardship permit | 30 days - 1 year | no minimum, but up to $4000 +conviction based surcharge of $1500 for three consecutive years; HBAC surcharge $2000 for three consecutive years | 80-200 hours community service; required evaluation, DUI education, and victim impact panel; required IID |
| 3rd Offense | 180 days - 2 years, may be elegible for hardship permit | 2-10 years | no minimum, but up to $10,000 | 160-600 hours community service; evaluation, DUI education, vicitm impact panel and IID required |
| 4th Offense | same as 3rd |
As you can see in the table above, the penalties for a fourth offense are the same as those for a third offense.
Marijuana-Impaired Driving Laws
There currently aren’t any specific laws about driving with marijuana in your system, but that doesn’t mean you can’t be pulled over for something called impaired-driving.
Drive sober or get pulled over! Don’t drink and drive and don’t do drugs – especially not while you’re driving.
Disobeying these laws could cost you money in fines, your life, or someone else’s.
Distracted Driving Laws
Studies have shown that the effects of texting and driving can sometimes be worse than drinking and driving.
Taking your eyes off the road for just a few seconds to send a text or answer a phone call can easily cause a driver to wind up in an accident.
| Cell Phone Laws in Texas | Details |
|---|---|
| Hand-Held Ban | drivers in school crossing zones and on public school property during the time the reduced speed limit applies |
| Text Ban | all drivers |
| Young drivers all cellphone ban | drivers younger than 18 |
| Enforcement | primary |
Driving in Texas
We’ve gone over insurance laws, rules of the road, safety laws, state laws and more. Now it’s time to get into some can’t-miss Texas facts.
In this next section, we’ll talk about what it’s like to drive in the state of Texas, risks of the road, vehicle theft, traffic fatality rates, and traffic congestion.
The information below is brought to you by Data USA, Responsibility.org, the NHTSA Crash Report by State, the FBI, Inrix, and census.gov.
– Vehicle Theft in Texas
Below is a list of the top 10 most stolen vehicles in the state of Texas.
| Make/Model | Year of Vehicle | Number of Thefts |
|---|---|---|
| Ford Pickup (Full Size) | 2006 | 7,897 |
| Chevrolet Pickup (Full Size) | 2004 | 6,158 |
| Dodge Pickup (Full Size) | 2004 | 2,898 |
| Honda Accord | 1997 | 1,626 |
| GMC Pickup (Full Size) | 2015 | 1,450 |
| Honda Civic | 2000 | 1,371 |
| Chevrolet Tahoe | 2004 | 1,148 |
| Toyota Camry | 2014 | 1,030 |
| Nissan Altima | 2012 | 957 |
| Chevrolet Impala | 2007 | 898 |
For the top 10 stolen vehicles in each state, the year with the vehicle is just the most popular model year stolen.
According to the list above, the 2006 Ford pickup is the most common stolen vehicle.
This next list shows vehicle theft by city in 2017. The data is collected from the FBI.
| State | Motor vehicle theft |
|---|---|
| Abernathy | 8 |
| Abilene | 260 |
| Addison | 97 |
| Alamo | 51 |
| Alamo Heights | 5 |
| Alice | 38 |
| Allen | 52 |
| Alpine | 7 |
| Alton | 12 |
| Alvarado | 13 |
| Alvin | 60 |
| Amarillo | 990 |
| Andrews | 16 |
| Anna | 11 |
| Anson | 3 |
| Anthony | 11 |
| Aransas Pass | 23 |
| Arcola | 0 |
| Argyle | 2 |
| Arlington3 | 1,360 |
| Arp | 0 |
| Athens | 27 |
| Atlanta | 5 |
| Aubrey | 3 |
| Austin | 2,079 |
| Azle | 7 |
| Baird | 4 |
| Balch Springs3 | 146 |
| Balcones Heights | 42 |
| Ballinger | 1 |
| Bangs | 0 |
| Bartonville | 2 |
| Bastrop | 23 |
| Bay City3 | 11 |
| Bayou Vista | 0 |
| Baytown | 326 |
| Beaumont | 405 |
| Bedford | 102 |
| Bee Cave | 5 |
| Beeville | 8 |
| Bellaire | 12 |
| Bellmead3 | 28 |
| Bellville3 | 0 |
| Belton | 4 |
| Benbrook | 21 |
| Beverly Hills | 9 |
| Big Sandy | 1 |
| Big Spring | 85 |
| Bishop | 4 |
| Blanco | 1 |
| Blue Mound | 4 |
| Boerne | 29 |
| Bogata | 1 |
| Bonham | 4 |
| Borger3 | 36 |
| Bovina | 1 |
| Bowie | 9 |
| Boyd | 1 |
| Brady | 6 |
| Brazoria | 5 |
| Breckenridge | 3 |
| Bridge City | 13 |
| Bridgeport3 | 4 |
| Brookshire | 12 |
| Brownfield | 8 |
| Brownsville | 141 |
| Brownwood | 22 |
| Bryan | 123 |
| Buda | 11 |
| Bullard | 1 |
| Bulverde | 0 |
| Burkburnett | 21 |
| Burleson | 67 |
| Burnet3 | 9 |
| Cactus | 3 |
| Caddo Mills | 0 |
| Caldwell | 0 |
| Calvert | 2 |
| Cameron | 1 |
| Canton | 3 |
| Canyon | 10 |
| Carrollton | 227 |
| Carthage | 10 |
| Castle Hills3 | 21 |
| Castroville | 13 |
| Cedar Hill | 98 |
| Cedar Park | 51 |
| Celina | 4 |
| Center | 7 |
| Chandler | 2 |
| Cibolo | 14 |
| Cisco | 11 |
| Clarksville | 0 |
| Cleburne | 51 |
| Cleveland | 30 |
| Clifton | 4 |
| Clint | 0 |
| Clute | 18 |
| Clyde | 2 |
| Cockrell Hill | 15 |
| Coleman | 1 |
| College Station | 117 |
| Colleyville | 7 |
| Collinsville | 0 |
| Colorado City | 7 |
| Comanche | 1 |
| Combes | 0 |
| Commerce | 2 |
| Conroe | 176 |
| Converse | 47 |
| Coppell | 23 |
| Copperas Cove | 34 |
| Corinth | 21 |
| Corpus Christi | 731 |
| Corrigan3 | 4 |
| Corsicana | 37 |
| Crandall | 10 |
| Crane | 1 |
| Crockett | 7 |
| Crosbyton | 0 |
| Crowell | 0 |
| Crowley | 12 |
| Crystal City | 0 |
| Cuero2 | 9 |
| Cumby | 0 |
| Daingerfield | 3 |
| Dalhart | 16 |
| Dallas | 7,913 |
| Dalworthington Gardens | 4 |
| Danbury | 0 |
| Dayton3 | 20 |
| Decatur | 11 |
| Deer Park | 34 |
| De Kalb | 4 |
| De Leon | 2 |
| Del Rio | 19 |
| Denison | 70 |
| Denton | 298 |
| Denver City | 2 |
| DeSoto | 158 |
| Devine3 | 15 |
| Diboll | 3 |
| Dickinson | 47 |
| Dilley | 5 |
| Dimmitt | 9 |
| Donna3 | 47 |
| Double Oak3 | 0 |
| Driscoll | 1 |
| Dublin | 1 |
| Dumas | 28 |
| Duncanville | 169 |
| Eagle Lake | 0 |
| Eagle Pass | 33 |
| Early | 2 |
| Eastland3 | 1 |
| Edcouch | 3 |
| Edinburg | 108 |
| Edna | 7 |
| El Campo3 | 19 |
| Electra3 | 5 |
| El Paso | 800 |
| Elsa | 0 |
| Encinal | 1 |
| Ennis | 35 |
| Estelline | 0 |
| Euless | 140 |
| Fairfield | 3 |
| Fair Oaks Ranch | 2 |
| Fairview | 1 |
| Falfurrias | 0 |
| Farmers Branch | 92 |
| Farmersville | 2 |
| Farwell | 0 |
| Fate3 | 3 |
| Ferris | 1 |
| Flatonia | 1 |
| Floresville | 12 |
| Flower Mound | 19 |
| Floydada | 4 |
| Forest Hill | 36 |
| Forney | 23 |
| Fort Stockton | 7 |
| Fort Worth | 2,706 |
| Frankston3 | 2 |
| Fredericksburg | 3 |
| Freeport | 12 |
| Freer | 3 |
| Friendswood | 17 |
| Friona | 1 |
| Frisco | 84 |
| Fulshear | 2 |
| Fulton | 3 |
| Gainesville | 23 |
| Galveston | 284 |
| Ganado | 1 |
| Garden Ridge | 0 |
| Garland | 810 |
| Gatesville | 15 |
| Georgetown | 35 |
| George West | 5 |
| Giddings | 2 |
| Gilmer | 7 |
| Gladewater | 9 |
| Glenn Heights | 12 |
| Godley | 3 |
| Gonzales | 8 |
| Gorman | 1 |
| Graham | 10 |
| Granbury | 13 |
| Grand Prairie | 495 |
| Grand Saline | 2 |
| Granger | 1 |
| Granite Shoals | 6 |
| Grapeland | 0 |
| Grapevine | 85 |
| Greenville | 65 |
| Gregory | 1 |
| Groesbeck | 3 |
| Groves | 29 |
| Gun Barrel City | 12 |
| Hallettsville3 | 1 |
| Hallsville | 3 |
| Haltom City | 150 |
| Hamilton | 4 |
| Hamlin | 0 |
| Happy | 0 |
| Harker Heights | 52 |
| Harlingen | 91 |
| Haskell | 1 |
| Hawkins | 0 |
| Hawley | 1 |
| Hearne | 4 |
| Heath | 2 |
| Hedwig Village | 6 |
| Helotes | 3 |
| Hemphill | 0 |
| Henderson | 16 |
| Hereford | 24 |
| Hewitt | 8 |
| Hickory Creek | 6 |
| Hidalgo | 10 |
| Highland Park | 5 |
| Highland Village | 5 |
| Hill Country Village | 2 |
| Hillsboro | 24 |
| Hitchcock | 21 |
| Hollywood Park3 | 6 |
| Hondo | 16 |
| Hooks | 2 |
| Horizon City | 7 |
| Horseshoe Bay | 2 |
| Houston | 11,596 |
| Hughes Springs | 0 |
| Humble | 176 |
| Huntington | 3 |
| Huntsville | 88 |
| Hurst | 68 |
| Hutchins | 0 |
| Hutto | 4 |
| Idalou | 1 |
| Indian Lake3 | 0 |
| Ingleside | 17 |
| Ingram | 3 |
| Iowa Park | 7 |
| Irving | 711 |
| Itasca | 1 |
| Jacinto City | 35 |
| Jacksboro | 4 |
| Jacksonville3 | 16 |
| Jamaica Beach | 1 |
| Jarrell | 1 |
| Jasper | 14 |
| Jersey Village | 32 |
| Jones Creek | 1 |
| Jonestown | 6 |
| Josephine | 0 |
| Joshua | 7 |
| Jourdanton | 0 |
| Junction | 1 |
| Karnes City | 3 |
| Katy | 36 |
| Kaufman2, 3 | 17 |
| Keene | 4 |
| Keller | 11 |
| Kemah | 6 |
| Kenedy | 5 |
| Kennedale | 10 |
| Kermit | 0 |
| Kerrville | 23 |
| Kilgore | 29 |
| Killeen | 566 |
| Kingsville | 25 |
| Kirby | 42 |
| Knox City | 0 |
| Kountze | 7 |
| Kress | 0 |
| Kyle | 61 |
| Lacy-Lakeview | 11 |
| La Feria | 6 |
| Lago Vista | 3 |
| La Grange | 4 |
| La Grulla | 0 |
| Laguna Vista | 2 |
| La Joya | 1 |
| Lake City | 0 |
| Lake Dallas | 4 |
| Lake Jackson | 24 |
| Lakeside | 6 |
| Lakeview, Harrison County | 6 |
| Lakeway | 8 |
| Lake Worth | 15 |
| La Marque | 64 |
| Lampasas | 8 |
| Lancaster | 240 |
| La Porte | 49 |
| Laredo | 170 |
| La Vernia | 5 |
| La Villa | 0 |
| Lavon | 0 |
| League City | 93 |
| Leander | 24 |
| Leon Valley | 62 |
| Levelland | 31 |
| Lewisville | 229 |
| Liberty | 12 |
| Lindale | 13 |
| Linden | 4 |
| Little Elm | 26 |
| Littlefield3 | 7 |
| Live Oak | 39 |
| Livingston3 | 7 |
| Lockhart | 18 |
| Log Cabin | 3 |
| Lone Star | 0 |
| Longview | 242 |
| Lorena | 4 |
| Los Indios | 0 |
| Lufkin | 83 |
| Luling | 12 |
| Lumberton2 | 10 |
| Lyford | 3 |
| Lytle | 6 |
| Madisonville | 0 |
| Magnolia | 2 |
| Manor | 15 |
| Mansfield | 42 |
| Manvel | 9 |
| Marble Falls | 7 |
| Marshall | 65 |
| Martindale | 0 |
| Mathis | 3 |
| McAllen | 46 |
| McGregor | 1 |
| McKinney | 155 |
| Meadows Place | 12 |
| Melissa | 5 |
| Memorial Villages | 0 |
| Memphis | 1 |
| Mercedes | 33 |
| Merkel | 2 |
| Mesquite | 849 |
| Mexia | 3 |
| Midland | 220 |
| Midlothian | 22 |
| Milford | 1 |
| Mineola | 5 |
| Mission | 74 |
| Missouri City | 69 |
| Monahans | 6 |
| Mont Belvieu3 | 17 |
| Montgomery | 0 |
| Moulton | 0 |
| Mount Pleasant | 18 |
| Muleshoe | 4 |
| Munday | 0 |
| Murphy | 3 |
| Nacogdoches | 27 |
| Naples | 0 |
| Nash | 6 |
| Nassau Bay | 8 |
| Natalia | 0 |
| Navasota | 14 |
| Nederland | 36 |
| Needville | 2 |
| New Boston | 9 |
| New Braunfels | 148 |
| Newton | 2 |
| Nixon | 3 |
| Nocona | 1 |
| Nolanville | 3 |
| Normangee | 0 |
| Northeast | 3 |
| Northlake | 7 |
| North Richland Hills | 101 |
| Oak Ridge | 0 |
| Odessa | 273 |
| Olmos Park | 2 |
| Olney | 3 |
| Olton | 1 |
| Omaha | 1 |
| Onalaska | 3 |
| Orange | 47 |
| Ovilla | 2 |
| Oyster Creek | 3 |
| Paducah | 0 |
| Palacios | 3 |
| Palestine3 | 28 |
| Palmer | 5 |
| Palmhurst | 0 |
| Palm Valley | 0 |
| Palmview | 3 |
| Panhandle | 1 |
| Pantego3 | 9 |
| Paris | 48 |
| Parker | 4 |
| Pasadena | 379 |
| Patton Village | 7 |
| Pearsall | 11 |
| Pecos | 1 |
| Pelican Bay | 0 |
| Penitas | 2 |
| Perryton3 | 12 |
| Pflugerville3 | 45 |
| Pharr | 62 |
| Pilot Point | 1 |
| Pinehurst | 3 |
| Pittsburg | 5 |
| Plainview | 49 |
| Plano | 339 |
| Pleasanton | 29 |
| Ponder3 | 1 |
| Port Aransas | 27 |
| Port Arthur | 153 |
| Port Isabel | 12 |
| Portland | 9 |
| Port Lavaca | 23 |
| Port Mansfield | 0 |
| Port Neches | 26 |
| Poteet | 13 |
| Poth | 2 |
| Pottsboro | 0 |
| Prairie View | 1 |
| Premont | 2 |
| Presidio | 1 |
| Primera | 1 |
| Princeton3 | 5 |
| Prosper | 7 |
| Queen City | 2 |
| Quitman | 1 |
| Ralls | 0 |
| Rancho Viejo | 0 |
| Ranger | 3 |
| Raymondville | 6 |
| Red Oak | 24 |
| Refugio | 0 |
| Reno | 4 |
| Richardson | 189 |
| Richland Hills | 28 |
| Richmond | 9 |
| Richwood | 3 |
| Riesel | 0 |
| Rio Bravo | 0 |
| Rio Grande City | 39 |
| Rio Hondo | 2 |
| River Oaks | 17 |
| Roanoke | 11 |
| Robinson | 5 |
| Robstown | 12 |
| Rockdale3 | 8 |
| Rockport | 24 |
| Rockwall | 51 |
| Rollingwood | 0 |
| Roma | 22 |
| Roman Forest | 2 |
| Rosenberg | 59 |
| Round Rock | 64 |
| Rowlett | 71 |
| Royse City | 11 |
| Runaway Bay | 1 |
| Rusk | 2 |
| Sabinal | 0 |
| Sachse | 22 |
| Saginaw | 59 |
| Salado | 4 |
| San Angelo | 272 |
| San Antonio | 6,864 |
| San Augustine | 1 |
| San Benito | 25 |
| San Diego | 0 |
| Sanger | 5 |
| San Juan | 51 |
| San Marcos | 169 |
| San Saba | 3 |
| Sansom Park Village | 10 |
| Santa Anna | 0 |
| Santa Fe | 18 |
| Santa Rosa | 2 |
| Schertz | 57 |
| Schulenburg | 5 |
| Seabrook | 14 |
| Seagoville | 79 |
| Seagraves | 1 |
| Sealy | 15 |
| Seguin | 27 |
| Selma | 27 |
| Seminole3 | 8 |
| Seven Points | 6 |
| Seymour3 | 2 |
| Shallowater | 7 |
| Shamrock | 0 |
| Shavano Park | 2 |
| Shenandoah3 | 25 |
| Sherman | 77 |
| Shiner | 0 |
| Shoreacres | 0 |
| Sinton | 14 |
| Slaton | 13 |
| Smithville | 2 |
| Socorro | 22 |
| Somerset | 2 |
| Sonora | 0 |
| Sour Lake | 3 |
| South Houston3 | 106 |
| Southlake | 5 |
| South Padre Island | 14 |
| Southside Place | 0 |
| Spearman | 0 |
| Splendora | 4 |
| Springtown | 0 |
| Spring Valley | 4 |
| Spur | 0 |
| Stafford | 54 |
| Stagecoach | 0 |
| Stamford | 3 |
| Stephenville | 15 |
| Sugar Land | 56 |
| Sullivan City | 4 |
| Sulphur Springs | 13 |
| Sunrise Beach Village | 0 |
| Sunset Valley | 1 |
| Surfside Beach | 0 |
| Sweeny | 2 |
| Sweetwater3 | 26 |
| Taft | 3 |
| Tahoka | 2 |
| Tatum | 1 |
| Taylor | 33 |
| Teague | 7 |
| Temple | 238 |
| Terrell | 67 |
| Terrell Hills | 0 |
| Texarkana | 121 |
| Texas City | 123 |
| The Colony | 42 |
| Thorndale | 0 |
| Thrall | 0 |
| Three Rivers | 0 |
| Tioga | 2 |
| Tomball | 40 |
| Tool | 4 |
| Trophy Club | 8 |
| Troup | 2 |
| Tulia | 5 |
| Tye | 2 |
| Tyler | 146 |
| Universal City | 45 |
| University Park | 19 |
| Uvalde | 10 |
| Van | 7 |
| Van Alstyne | 3 |
| Venus | 4 |
| Vernon | 14 |
| Victoria | 110 |
| Vidor | 34 |
| Waco | 191 |
| Waelder | 0 |
| Wake Village | 10 |
| Waller | 5 |
| Wallis | 0 |
| Watauga | 14 |
| Waxahachie | 70 |
| Weatherford | 39 |
| Webster | 81 |
| Weimar | 4 |
| Weslaco | 50 |
| West | 1 |
| West Lake Hills3 | 5 |
| West Orange | 6 |
| Westover Hills | 1 |
| West University Place | 4 |
| Westworth | 5 |
| Wharton | 6 |
| Whitehouse | 2 |
| White Oak | 19 |
| Whitesboro | 3 |
| White Settlement | 49 |
| Wichita Falls | 238 |
| Willis | 11 |
| Willow Park3 | 3 |
| Wills Point | 2 |
| Wilmer | 8 |
| Windcrest | 30 |
| Wink | 1 |
| Winnsboro | 6 |
| Winters | 3 |
| Wolfforth | 0 |
| Woodbranch | 0 |
| Woodville | 0 |
| Woodway | 0 |
| Wortham | 1 |
| Wylie | 28 |
| Yoakum | 3 |
| Yorktown | 2 |
Some of these cities had zero theft in 2017.
Road Fatalities in Texas
Let’s move onto something a little more depressing – traffic fatality statistics. What caused them? Was it the weather? Were some vehicles more involved in traffic fatalities than others? How do you avoid them?
All that and more coming up next.
Most Fatal Highway in Texas
Every year, over 30,000 people are killed in road crashes in the United States. According to Geotab.com, US-83 (runs north and south in Texas) is the most dangerous highway in Texas.
To determine the most dangerous highway in Texas, a Fatal Crash Rate is calculated based on the annual number of road fatalities and fatal crashes according to the National Highway Traffic Safety Administration, adjusted for the average daily traffic counts provided by the Federal Highway Administration.
The US-83 (also known as the Texas Vietnam Veterans Memorial Highway) has had an average of 26 fatal crashes per year for the last 10 years.
Fatal Crashes by Weather Condition and Light Condition
Do you ever wonder if the weather patterns have anything to do with the traffic fatality rate?
| Weather Condition | Daylight | Dark, but Lighted | Dark | Dawn or Dusk | Other / Unknown | Total |
|---|---|---|---|---|---|---|
| Normal | 1,316 | 664 | 930 | 94 | 8 | 3,012 |
| Rain | 91 | 53 | 85 | 9 | 0 | 238 |
| Snow/Sleet | 9 | 0 | 1 | 0 | 0 | 10 |
| Other | 17 | 18 | 32 | 4 | 0 | 71 |
| Unknown | 3 | 0 | 3 | 0 | 6 | 12 |
| TOTAL | 1,436 | 735 | 1,051 | 107 | 14 | 3,343 |
According to the table above, over 90 percent of fatal crashes in Texas occurred in broad daylight under normal weather conditions. Some happened at night and in the rain, but mostly, we know that the weather was not the major culprit.
Fatalities (All Crashes) by County
Below are fatality rates for Texas counties.
| County | Fatalities 2013 | 2014 | 2015 | 2016 | 2017 | Fatalities Per 100K Population 2013 | 2014 | 2015 | 2016 | 2017 |
|---|---|---|---|---|---|---|---|---|---|---|
| Anderson County | 9 | 10 | 8 | 12 | 10 | 15.53 | 17.29 | 13.88 | 20.85 | 17.32 |
| Andrews County | 12 | 11 | 14 | 1 | 16 | 71.48 | 63.04 | 77.38 | 5.61 | 90.28 |
| Angelina County | 19 | 18 | 18 | 20 | 16 | 21.75 | 20.55 | 20.48 | 22.77 | 18.22 |
| Aransas County | 3 | 3 | 2 | 3 | 4 | 12.55 | 12.2 | 8.05 | 11.87 | 15.64 |
| Archer County | 7 | 5 | 0 | 4 | 2 | 79.61 | 56.59 | 0 | 45.59 | 22.7 |
| Armstrong County | 6 | 0 | 0 | 1 | 1 | 309.28 | 0 | 0 | 53.88 | 53.22 |
| Atascosa County | 7 | 17 | 17 | 6 | 9 | 14.89 | 35.64 | 35.16 | 12.33 | 18.37 |
| Austin County | 6 | 8 | 5 | 10 | 3 | 20.94 | 27.64 | 16.98 | 33.74 | 10.07 |
| Bailey County | 2 | 0 | 1 | 2 | 1 | 28.18 | 0 | 13.89 | 27.86 | 14.13 |
| Bandera County | 10 | 8 | 8 | 2 | 7 | 48.64 | 38.44 | 37.83 | 9.21 | 31.32 |
| Bastrop County | 21 | 14 | 20 | 37 | 26 | 27.67 | 17.97 | 24.94 | 44.71 | 30.67 |
| Baylor County | 7 | 3 | 6 | 0 | 1 | 195.69 | 84.1 | 164.43 | 0 | 27.93 |
| Bee County | 4 | 8 | 5 | 8 | 3 | 12.19 | 24.36 | 15.33 | 24.36 | 9.21 |
| Bell County | 36 | 34 | 40 | 42 | 57 | 11 | 10.3 | 11.9 | 12.31 | 16.39 |
| Bexar County | 189 | 184 | 189 | 226 | 164 | 10.38 | 9.91 | 9.97 | 11.72 | 8.37 |
| Blanco County | 5 | 9 | 4 | 8 | 3 | 47.01 | 83.3 | 36.24 | 70.54 | 25.8 |
| Borden County | 1 | 1 | 1 | 1 | 0 | 154.8 | 150.15 | 152.44 | 151.52 | 0 |
| Bosque County | 5 | 4 | 4 | 2 | 5 | 27.99 | 22.58 | 22.39 | 11.1 | 27.28 |
| Bowie County | 25 | 18 | 14 | 22 | 16 | 26.75 | 19.27 | 14.99 | 23.43 | 17.02 |
| Brazoria County | 45 | 30 | 42 | 48 | 43 | 13.63 | 8.88 | 12.15 | 13.57 | 11.86 |
| Brazos County | 15 | 14 | 22 | 20 | 28 | 7.35 | 6.71 | 10.19 | 9.11 | 12.57 |
| Brewster County | 3 | 1 | 1 | 0 | 0 | 32.29 | 10.93 | 10.95 | 0 | 0 |
| Briscoe County | 0 | 0 | 0 | 2 | 0 | 0 | 0 | 0 | 134.59 | 0 |
| Brooks County | 8 | 6 | 3 | 1 | 1 | 110.18 | 82.69 | 41.45 | 13.77 | 13.82 |
| Brown County | 2 | 2 | 6 | 5 | 3 | 5.32 | 5.33 | 15.91 | 13.14 | 7.88 |
| Burleson County | 3 | 4 | 4 | 11 | 5 | 17.4 | 23.05 | 22.78 | 61.76 | 27.76 |
| Burnet County | 8 | 20 | 11 | 9 | 16 | 18.35 | 45.48 | 24.56 | 19.6 | 34.19 |
| Caldwell County | 4 | 15 | 12 | 9 | 11 | 10.2 | 37.79 | 29.72 | 21.89 | 25.98 |
| Calhoun County | 7 | 3 | 1 | 1 | 1 | 32.21 | 13.76 | 4.57 | 4.56 | 4.6 |
| Callahan County | 12 | 4 | 6 | 7 | 10 | 88.92 | 29.63 | 44.18 | 50.81 | 71.71 |
| Cameron County | 39 | 26 | 25 | 41 | 40 | 9.35 | 6.21 | 5.96 | 9.72 | 9.44 |
| Camp County | 2 | 4 | 1 | 1 | 3 | 16.08 | 31.69 | 7.9 | 7.83 | 23.34 |
| Carson County | 1 | 3 | 9 | 6 | 3 | 16.71 | 49.73 | 149.83 | 98.25 | 49.73 |
| Cass County | 7 | 3 | 14 | 4 | 10 | 23.15 | 9.96 | 46.45 | 13.3 | 33.32 |
| Castro County | 2 | 4 | 1 | 0 | 1 | 24.75 | 50.58 | 12.82 | 0 | 12.75 |
| Chambers County | 13 | 20 | 15 | 22 | 9 | 34.81 | 52.24 | 38.4 | 54.61 | 21.72 |
| Cherokee County | 15 | 13 | 8 | 9 | 10 | 29.36 | 25.4 | 15.51 | 17.34 | 19.14 |
| Childress County | 2 | 0 | 1 | 2 | 3 | 28.35 | 0 | 14.2 | 28.19 | 42.45 |
| Clay County | 6 | 2 | 1 | 0 | 6 | 57.4 | 19.28 | 9.66 | 0 | 57.58 |
| Cochran County | 0 | 2 | 0 | 1 | 0 | 0 | 68.17 | 0 | 34.35 | 0 |
| Coke County | 1 | 5 | 5 | 4 | 1 | 31.46 | 155.52 | 155.04 | 122.59 | 30.25 |
| Coleman County | 1 | 4 | 4 | 6 | 1 | 11.73 | 47.53 | 48.11 | 71.25 | 11.86 |
| Collin County | 41 | 47 | 37 | 50 | 68 | 4.78 | 5.31 | 4.05 | 5.31 | 7.01 |
| Collingsworth County | 0 | 0 | 3 | 0 | 0 | 0 | 0 | 99.67 | 0 | 0 |
| Colorado County | 15 | 5 | 14 | 8 | 10 | 72.44 | 24.17 | 66.95 | 38.05 | 47.1 |
| Comal County | 21 | 20 | 17 | 24 | 17 | 17.71 | 16.24 | 13.21 | 17.89 | 12.06 |
| Comanche County | 5 | 2 | 4 | 8 | 7 | 36.93 | 14.86 | 29.92 | 59.17 | 51.57 |
| Concho County | 4 | 1 | 0 | 0 | 4 | 97.7 | 24.6 | 0 | 0 | 147.22 |
| Cooke County | 3 | 20 | 13 | 6 | 10 | 7.81 | 51.69 | 33.28 | 15.29 | 25.07 |
| Coryell County | 7 | 5 | 13 | 14 | 9 | 9.12 | 6.56 | 17.05 | 18.68 | 12.01 |
| Cottle County | 0 | 1 | 0 | 0 | 0 | 0 | 70.03 | 0 | 0 | 0 |
| Crane County | 2 | 3 | 2 | 0 | 1 | 42.35 | 61.15 | 39.94 | 0 | 21.1 |
| Crockett County | 5 | 5 | 3 | 4 | 7 | 132.94 | 132.07 | 80.39 | 109.5 | 196.41 |
| Crosby County | 0 | 1 | 4 | 5 | 1 | 0 | 17.17 | 67.61 | 84.5 | 16.95 |
| Culberson County | 2 | 6 | 12 | 3 | 3 | 86.77 | 263.16 | 533.1 | 135.2 | 134.47 |
| Dallam County | 1 | 8 | 1 | 4 | 3 | 14.08 | 111.06 | 13.77 | 55.13 | 41.62 |
| Dallas County | 225 | 238 | 259 | 315 | 282 | 9.06 | 9.45 | 10.14 | 12.17 | 10.77 |
| Dawson County | 4 | 6 | 4 | 4 | 2 | 30.3 | 44.66 | 30.81 | 30.67 | 15.61 |
| Deaf Smith County | 2 | 3 | 2 | 3 | 3 | 10.44 | 15.71 | 10.64 | 15.92 | 15.93 |
| Delta County | 2 | 0 | 2 | 6 | 0 | 39.08 | 0 | 38.78 | 116.6 | 0 |
| Denton County | 40 | 37 | 38 | 49 | 49 | 5.49 | 4.91 | 4.87 | 6.06 | 5.86 |
| Dewitt County | 9 | 7 | 3 | 5 | 5 | 44.16 | 34.12 | 14.54 | 24.25 | 24.72 |
| Dickens County | 0 | 0 | 1 | 1 | 4 | 0 | 0 | 45.41 | 45.43 | 181.08 |
| Dimmit County | 10 | 13 | 8 | 2 | 3 | 91.7 | 117.96 | 72.85 | 18.55 | 28.8 |
| Donley County | 1 | 4 | 0 | 2 | 2 | 28.04 | 114.22 | 0 | 58.96 | 60.4 |
| Duval County | 5 | 3 | 6 | 4 | 6 | 43.15 | 26.04 | 52.9 | 34.94 | 53.22 |
| Eastland County | 8 | 9 | 8 | 6 | 6 | 43.77 | 49.35 | 44.05 | 32.78 | 32.59 |
| Ector County | 59 | 48 | 54 | 34 | 48 | 39.43 | 31.05 | 33.78 | 21.58 | 30.56 |
| Edwards County | 0 | 0 | 3 | 1 | 1 | 0 | 0 | 157.07 | 52.14 | 51.2 |
| El Paso County | 60 | 66 | 62 | 81 | 58 | 7.23 | 7.92 | 7.44 | 9.68 | 6.9 |
| Ellis County | 19 | 24 | 25 | 28 | 33 | 12.18 | 15.08 | 15.31 | 16.63 | 19.01 |
| Erath County | 10 | 15 | 18 | 13 | 10 | 25.06 | 37 | 43.67 | 31.37 | 23.83 |
| Falls County | 8 | 7 | 4 | 7 | 3 | 46.4 | 40.68 | 23.22 | 40.39 | 17.2 |
| Fannin County | 6 | 5 | 8 | 15 | 14 | 17.89 | 14.87 | 23.9 | 44.31 | 40.64 |
| Fayette County | 9 | 9 | 16 | 9 | 17 | 36.41 | 36.31 | 64.08 | 35.9 | 67.27 |
| Fisher County | 1 | 6 | 2 | 2 | 2 | 25.85 | 154.92 | 51.67 | 51.53 | 51.55 |
| Floyd County | 2 | 2 | 0 | 1 | 2 | 32.03 | 33.64 | 0 | 17.02 | 34.16 |
| Foard County | 2 | 1 | 0 | 1 | 1 | 155.28 | 78.31 | 0 | 82.58 | 81.83 |
| Fort Bend County | 52 | 36 | 39 | 37 | 39 | 7.97 | 5.26 | 5.46 | 4.99 | 5.1 |
| Franklin County | 2 | 4 | 4 | 10 | 0 | 18.85 | 37.87 | 37.76 | 93.82 | 0 |
| Freestone County | 5 | 8 | 11 | 14 | 8 | 25.52 | 40.7 | 55.8 | 71.26 | 40.76 |
| Frio County | 7 | 1 | 9 | 3 | 3 | 38.08 | 5.28 | 46.73 | 15.48 | 15.31 |
| Gaines County | 11 | 5 | 10 | 5 | 3 | 58.53 | 25.88 | 49.47 | 24.41 | 14.54 |
| Galveston County | 23 | 35 | 44 | 45 | 40 | 7.5 | 11.16 | 13.69 | 13.67 | 11.94 |
| Garza County | 1 | 8 | 0 | 1 | 2 | 15.69 | 124.84 | 0 | 15.52 | 30.64 |
| Gillespie County | 6 | 4 | 5 | 7 | 11 | 23.7 | 15.71 | 19.26 | 26.61 | 41.28 |
| Glasscock County | 4 | 4 | 6 | 2 | 3 | 316.46 | 303.72 | 438.28 | 148.15 | 222.55 |
| Goliad County | 3 | 3 | 4 | 4 | 1 | 40.26 | 39.98 | 53.26 | 53.18 | 13.22 |
| Gonzales County | 11 | 13 | 15 | 13 | 12 | 54.62 | 63.86 | 73.04 | 62.31 | 57.44 |
| Gray County | 3 | 4 | 6 | 5 | 6 | 13.05 | 17.07 | 25.81 | 21.99 | 26.78 |
| Grayson County | 27 | 19 | 26 | 24 | 22 | 22.08 | 15.38 | 20.71 | 18.72 | 16.78 |
| Gregg County | 21 | 22 | 26 | 21 | 32 | 17.05 | 17.88 | 20.99 | 16.99 | 25.94 |
| Grimes County | 10 | 5 | 16 | 8 | 11 | 37.32 | 18.51 | 58.54 | 29.01 | 39.17 |
| Guadalupe County | 16 | 15 | 19 | 24 | 19 | 11.2 | 10.22 | 12.62 | 15.52 | 11.9 |
| Hale County | 1 | 8 | 4 | 3 | 4 | 2.8 | 23.2 | 11.73 | 8.77 | 11.72 |
| Hall County | 3 | 0 | 2 | 0 | 1 | 94.85 | 0 | 64.68 | 0 | 32.56 |
| Hamilton County | 4 | 7 | 7 | 0 | 3 | 48.61 | 85.89 | 86.74 | 0 | 35.62 |
| Hansford County | 2 | 2 | 3 | 0 | 2 | 36.13 | 36.13 | 53.49 | 0 | 36.72 |
| Hardeman County | 2 | 4 | 1 | 2 | 2 | 49.21 | 100.3 | 25.56 | 50.11 | 50.08 |
| Hardin County | 11 | 13 | 9 | 11 | 12 | 19.89 | 23.42 | 16.14 | 19.55 | 21 |
| Harris County | 369 | 417 | 391 | 447 | 456 | 8.48 | 9.37 | 8.59 | 9.68 | 9.8 |
| Harrison County | 22 | 14 | 26 | 16 | 17 | 33.21 | 21.01 | 38.95 | 23.98 | 25.5 |
| Hartley County | 4 | 3 | 8 | 5 | 5 | 66.74 | 49.68 | 140.99 | 87.63 | 87.86 |
| Haskell County | 3 | 6 | 4 | 2 | 4 | 50.8 | 103.47 | 68.76 | 34.69 | 69.61 |
| Hays County | 23 | 18 | 17 | 39 | 30 | 13.07 | 9.74 | 8.74 | 19.09 | 13.99 |
| Hemphill County | 1 | 3 | 1 | 1 | 0 | 24.14 | 71.86 | 23.3 | 24.24 | 0 |
| Henderson County | 12 | 12 | 17 | 11 | 16 | 15.26 | 15.14 | 21.4 | 13.74 | 19.74 |
| Hidalgo County | 65 | 65 | 67 | 75 | 60 | 7.95 | 7.84 | 7.98 | 8.82 | 6.97 |
| Hill County | 16 | 14 | 16 | 13 | 10 | 45.91 | 40.26 | 45.92 | 36.96 | 27.89 |
| Hockley County | 6 | 7 | 5 | 7 | 4 | 25.64 | 29.84 | 21.45 | 30.3 | 17.33 |
| Hood County | 5 | 8 | 3 | 15 | 11 | 9.45 | 14.86 | 5.42 | 26.43 | 18.88 |
| Hopkins County | 7 | 8 | 9 | 9 | 13 | 19.83 | 22.42 | 25.03 | 24.86 | 35.62 |
| Houston County | 8 | 6 | 8 | 14 | 10 | 35.08 | 26.32 | 35.19 | 61.17 | 43.44 |
| Howard County | 12 | 6 | 12 | 8 | 9 | 33.19 | 16.44 | 32.32 | 21.85 | 24.97 |
| Hudspeth County | 14 | 15 | 7 | 12 | 14 | 419.54 | 460.41 | 203.73 | 294.62 | 317.6 |
| Hunt County | 15 | 18 | 22 | 28 | 26 | 17.15 | 20.3 | 24.53 | 30.45 | 27.7 |
| Hutchinson County | 6 | 8 | 6 | 5 | 0 | 27.4 | 36.53 | 27.55 | 23.18 | 0 |
| Irion County | 2 | 10 | 3 | 0 | 0 | 124.15 | 635.32 | 194.43 | 0 | 0 |
| Jack County | 3 | 5 | 6 | 3 | 1 | 33.71 | 56.43 | 67.88 | 34.22 | 11.32 |
| Jackson County | 6 | 5 | 10 | 6 | 3 | 41.07 | 33.97 | 67.6 | 40.4 | 20.26 |
| Jasper County | 8 | 5 | 12 | 7 | 8 | 22.47 | 14.12 | 34.04 | 19.77 | 22.5 |
| Jeff Davis County | 3 | 2 | 0 | 0 | 2 | 134.47 | 90.09 | 0 | 0 | 87.72 |
| Jefferson County | 23 | 32 | 27 | 37 | 37 | 9.09 | 12.66 | 10.59 | 14.46 | 14.44 |
| Jim Hogg County | 1 | 6 | 1 | 3 | 0 | 19.01 | 112.78 | 18.93 | 57.21 | 0 |
| Jim Wells County | 14 | 10 | 15 | 4 | 7 | 33.6 | 24.11 | 36.17 | 9.73 | 17.13 |
| Johnson County | 19 | 23 | 22 | 23 | 21 | 12.3 | 14.67 | 13.8 | 14.12 | 12.55 |
| Jones County | 7 | 5 | 8 | 5 | 9 | 34.94 | 25.19 | 40.03 | 25.01 | 45.04 |
| Karnes County | 11 | 7 | 9 | 5 | 4 | 74.72 | 47.19 | 59.03 | 32.76 | 26.34 |
| Kaufman County | 12 | 24 | 18 | 27 | 31 | 11.08 | 21.64 | 15.77 | 22.87 | 25.23 |
| Kendall County | 8 | 5 | 9 | 5 | 4 | 21.53 | 13.02 | 22.52 | 11.91 | 9.09 |
| Kenedy County | 2 | 0 | 2 | 2 | 2 | 459.77 | 0 | 461.89 | 467.29 | 479.62 |
| Kent County | 0 | 1 | 0 | 0 | 1 | 0 | 133.69 | 0 | 0 | 131.06 |
| Kerr County | 16 | 15 | 8 | 11 | 3 | 32.15 | 29.84 | 15.76 | 21.44 | 5.8 |
| Kimble County | 4 | 0 | 9 | 12 | 7 | 89.61 | 0 | 204.92 | 271 | 158.73 |
| King County | 0 | 0 | 1 | 0 | 0 | 0 | 0 | 352.11 | 0 | 0 |
| Kinney County | 2 | 0 | 2 | 2 | 0 | 55.08 | 0 | 55.66 | 54.95 | 0 |
| Kleberg County | 5 | 7 | 3 | 11 | 5 | 15.62 | 21.98 | 9.55 | 35.09 | 16.08 |
| Knox County | 1 | 1 | 1 | 1 | 1 | 26.87 | 26.31 | 26.37 | 26.74 | 26.95 |
| La Salle County | 9 | 17 | 4 | 1 | 7 | 120.97 | 227.3 | 52.33 | 13.13 | 92.3 |
| Lamar County | 7 | 14 | 8 | 10 | 6 | 14.26 | 28.34 | 16.21 | 20.18 | 12.1 |
| Lamb County | 8 | 4 | 4 | 4 | 2 | 58.58 | 29.66 | 30.15 | 30.25 | 15.14 |
| Lampasas County | 3 | 1 | 6 | 5 | 6 | 14.9 | 4.97 | 29.39 | 24.2 | 28.53 |
| Lavaca County | 4 | 5 | 7 | 4 | 7 | 20.38 | 25.28 | 35.15 | 20.09 | 34.89 |
| Lee County | 8 | 10 | 15 | 9 | 3 | 48.33 | 60.12 | 88.85 | 52.95 | 17.46 |
| Leon County | 12 | 10 | 8 | 12 | 7 | 72.18 | 59.76 | 46.97 | 69.78 | 40.6 |
| Liberty County | 23 | 16 | 18 | 22 | 39 | 29.94 | 20.51 | 22.63 | 27.03 | 46.62 |
| Limestone County | 4 | 8 | 5 | 4 | 3 | 17.09 | 34.04 | 21.33 | 17 | 12.75 |
| Lipscomb County | 0 | 0 | 1 | 0 | 0 | 0 | 0 | 28.11 | 0 | 0 |
| Live Oak County | 14 | 18 | 8 | 6 | 10 | 118.49 | 149.45 | 65.8 | 49.91 | 82.14 |
| Llano County | 4 | 3 | 2 | 9 | 3 | 20.51 | 15.28 | 9.97 | 43.75 | 14.14 |
| Loving County | 0 | 2 | 2 | 3 | 1 | 0 | 2247.19 | 1680.67 | 2608.7 | 746.27 |
| Lubbock County | 32 | 42 | 40 | 43 | 42 | 11.05 | 14.26 | 13.4 | 14.22 | 13.76 |
| Lynn County | 1 | 0 | 6 | 4 | 4 | 17.46 | 0 | 104.42 | 69.03 | 68.27 |
| Madison County | 7 | 12 | 6 | 10 | 7 | 50.72 | 86.69 | 43.05 | 70.95 | 49.22 |
| Marion County | 7 | 1 | 6 | 2 | 9 | 68.14 | 9.85 | 59.25 | 19.83 | 89.43 |
| Martin County | 3 | 9 | 11 | 6 | 5 | 56.88 | 164.47 | 193.8 | 105.49 | 88.87 |
| Mason County | 2 | 0 | 0 | 1 | 3 | 48.72 | 0 | 0 | 24.03 | 71.06 |
| Matagorda County | 8 | 4 | 13 | 10 | 10 | 21.91 | 10.96 | 35.36 | 26.94 | 27.14 |
| Maverick County | 5 | 8 | 8 | 10 | 9 | 8.86 | 14.03 | 13.87 | 17.24 | 15.46 |
| Mcculloch County | 0 | 9 | 4 | 2 | 0 | 0 | 110.4 | 48.47 | 24.63 | 0 |
| Mclennan County | 35 | 39 | 30 | 28 | 44 | 14.5 | 16.04 | 12.23 | 11.31 | 17.51 |
| Mcmullen County | 0 | 9 | 4 | 1 | 0 | 0 | 1132.08 | 482.51 | 122.7 | 0 |
| Medina County | 11 | 3 | 9 | 14 | 17 | 23.27 | 6.27 | 18.6 | 28.46 | 33.96 |
| Menard County | 1 | 0 | 1 | 0 | 1 | 46.84 | 0 | 46.93 | 0 | 47.08 |
| Midland County | 44 | 47 | 33 | 25 | 50 | 28.89 | 30.02 | 20.37 | 15.29 | 30.29 |
| Milam County | 4 | 10 | 3 | 5 | 17 | 16.61 | 41.41 | 12.31 | 20.21 | 67.86 |
| Mills County | 1 | 5 | 1 | 2 | 3 | 20.54 | 102.73 | 20.46 | 40.87 | 60.96 |
| Mitchell County | 1 | 4 | 5 | 3 | 5 | 11.11 | 44.12 | 56.46 | 35.38 | 59.05 |
| Montague County | 3 | 4 | 4 | 3 | 6 | 15.47 | 20.64 | 20.75 | 15.44 | 30.71 |
| Montgomery County | 51 | 53 | 60 | 76 | 54 | 10.23 | 10.26 | 11.21 | 13.71 | 9.46 |
| Moore County | 17 | 8 | 4 | 6 | 5 | 76.77 | 36.33 | 18.28 | 27.35 | 22.63 |
| Morris County | 2 | 4 | 2 | 6 | 4 | 15.77 | 31.7 | 16.14 | 48.04 | 32.08 |
| Motley County | 1 | 1 | 0 | 0 | 0 | 83.89 | 87.03 | 0 | 0 | 0 |
| Nacogdoches County | 16 | 11 | 16 | 13 | 13 | 24.55 | 16.87 | 24.44 | 19.8 | 19.82 |
| Navarro County | 13 | 10 | 11 | 5 | 14 | 27.07 | 20.87 | 22.84 | 10.34 | 28.75 |
| Newton County | 2 | 7 | 4 | 5 | 3 | 13.95 | 48.96 | 28.23 | 35.25 | 21.5 |
| Nolan County | 10 | 6 | 2 | 10 | 16 | 66.42 | 39.7 | 13.3 | 66.81 | 108.33 |
| Nueces County | 32 | 37 | 42 | 45 | 51 | 9.07 | 10.38 | 11.65 | 12.45 | 14.12 |
| Ochiltree County | 4 | 9 | 2 | 1 | 0 | 37.49 | 84.23 | 18.7 | 9.71 | 0 |
| Oldham County | 7 | 5 | 8 | 3 | 5 | 335.09 | 241.55 | 387.6 | 144.65 | 236.52 |
| Orange County | 13 | 28 | 19 | 22 | 23 | 15.7 | 33.64 | 22.64 | 26.03 | 27.04 |
| Palo Pinto County | 11 | 8 | 10 | 8 | 8 | 39.47 | 28.56 | 35.77 | 28.44 | 28 |
| Panola County | 11 | 11 | 10 | 13 | 6 | 46.25 | 46.33 | 42.27 | 55.46 | 25.81 |
| Parker County | 18 | 15 | 18 | 21 | 20 | 15.03 | 12.28 | 14.33 | 16.3 | 14.99 |
| Parmer County | 1 | 4 | 3 | 2 | 2 | 10.04 | 40.27 | 30.61 | 20.37 | 20.32 |
| Pecos County | 7 | 17 | 12 | 9 | 19 | 44.71 | 107.34 | 74.92 | 56.69 | 121.53 |
| Polk County | 12 | 13 | 15 | 12 | 15 | 26.36 | 28.37 | 32.18 | 25.14 | 30.51 |
| Potter County | 30 | 26 | 20 | 29 | 32 | 24.57 | 21.32 | 16.51 | 24.06 | 26.57 |
| Presidio County | 0 | 1 | 1 | 1 | 1 | 0 | 13.91 | 14.18 | 13.95 | 13.97 |
| Rains County | 2 | 2 | 1 | 4 | 1 | 18.14 | 18.17 | 8.99 | 35.38 | 8.5 |
| Randall County | 13 | 14 | 14 | 14 | 7 | 10.26 | 10.88 | 10.74 | 10.57 | 5.21 |
| Reagan County | 4 | 5 | 6 | 0 | 1 | 110.19 | 132 | 157.52 | 0 | 26.95 |
| Real County | 3 | 2 | 5 | 3 | 2 | 90.39 | 59.74 | 151.65 | 88.31 | 58.33 |
| Red River County | 4 | 1 | 4 | 4 | 4 | 32.01 | 8.03 | 32.35 | 32.74 | 32.71 |
| Reeves County | 17 | 12 | 21 | 14 | 15 | 119.81 | 82.71 | 140.88 | 92.91 | 98.16 |
| Refugio County | 7 | 14 | 3 | 3 | 7 | 96.25 | 190.37 | 40.98 | 41.14 | 96.9 |
| Roberts County | 1 | 5 | 0 | 1 | 4 | 108.81 | 547.05 | 0 | 109.17 | 426.44 |
| Robertson County | 7 | 1 | 4 | 7 | 4 | 42.62 | 6.08 | 23.97 | 41.52 | 23.25 |
| Rockwall County | 8 | 3 | 4 | 12 | 13 | 9.44 | 3.45 | 4.44 | 12.85 | 13.43 |
| Runnels County | 1 | 8 | 2 | 4 | 1 | 9.82 | 77.93 | 19.31 | 39.01 | 9.74 |
| Rusk County | 25 | 14 | 15 | 19 | 17 | 46.87 | 26.33 | 28.34 | 35.95 | 32.18 |
| Sabine County | 4 | 5 | 2 | 3 | 5 | 38.38 | 47.95 | 19.14 | 28.89 | 47.8 |
| San Augustine County | 6 | 3 | 4 | 4 | 10 | 69.25 | 35.41 | 47.96 | 48.29 | 121.17 |
| San Jacinto County | 9 | 8 | 6 | 14 | 5 | 33.66 | 29.57 | 21.93 | 50.44 | 17.69 |
| San Patricio County | 12 | 16 | 7 | 8 | 15 | 18.14 | 24.01 | 10.43 | 11.89 | 22.32 |
| San Saba County | 3 | 2 | 0 | 1 | 0 | 52.72 | 34.39 | 0 | 17.03 | 0 |
| Schleicher County | 5 | 0 | 0 | 0 | 0 | 156.79 | 0 | 0 | 0 | 0 |
| Scurry County | 4 | 6 | 4 | 1 | 2 | 23.17 | 34.48 | 22.74 | 5.74 | 11.73 |
| Shackelford County | 3 | 2 | 1 | 1 | 1 | 88.78 | 60.17 | 29.9 | 29.73 | 30.05 |
| Shelby County | 6 | 12 | 8 | 7 | 11 | 23.09 | 46.75 | 31.37 | 27.16 | 43.12 |
| Sherman County | 2 | 1 | 1 | 0 | 0 | 65.17 | 32.59 | 32.68 | 0 | 0 |
| Smith County | 29 | 43 | 61 | 57 | 46 | 13.4 | 19.59 | 27.43 | 25.3 | 20.2 |
| Somervell County | 6 | 4 | 2 | 2 | 9 | 70.1 | 46.77 | 23.22 | 23.04 | 101.75 |
| Starr County | 13 | 7 | 2 | 3 | 3 | 20.87 | 11.13 | 3.15 | 4.69 | 4.65 |
| Stephens County | 2 | 1 | 2 | 2 | 1 | 21.37 | 10.71 | 21.32 | 21.26 | 10.71 |
| Sterling County | 0 | 2 | 3 | 0 | 0 | 0 | 149.81 | 225.39 | 0 | 0 |
| Stonewall County | 3 | 1 | 0 | 0 | 1 | 211.57 | 72.1 | 0 | 0 | 72.05 |
| Sutton County | 6 | 3 | 4 | 3 | 3 | 150.72 | 75.78 | 102.67 | 77.62 | 79.64 |
| Swisher County | 3 | 1 | 1 | 1 | 1 | 38.88 | 13.24 | 13.37 | 13.44 | 13.31 |
| Tarrant County | 144 | 145 | 157 | 167 | 180 | 7.53 | 7.45 | 7.91 | 8.26 | 8.76 |
| Taylor County | 20 | 26 | 28 | 17 | 15 | 14.94 | 19.29 | 20.6 | 12.5 | 11.01 |
| Terrell County | 1 | 1 | 0 | 1 | 0 | 112.23 | 110.25 | 0 | 122.25 | 0 |
| Terry County | 7 | 3 | 3 | 1 | 2 | 55.14 | 23.47 | 23.52 | 7.8 | 15.73 |
| Throckmorton County | 0 | 0 | 0 | 0 | 2 | 0 | 0 | 0 | 0 | 130.98 |
| Titus County | 5 | 7 | 11 | 4 | 6 | 15.33 | 21.57 | 33.62 | 12.26 | 18.23 |
| Tom Green County | 15 | 15 | 17 | 7 | 11 | 13.08 | 12.89 | 14.46 | 5.94 | 9.32 |
| Travis County | 112 | 95 | 145 | 120 | 120 | 9.98 | 8.25 | 12.31 | 9.96 | 9.78 |
| Trinity County | 5 | 4 | 4 | 9 | 2 | 34.62 | 28.02 | 27.57 | 62.01 | 13.64 |
| Tyler County | 10 | 8 | 11 | 4 | 2 | 46.52 | 37.3 | 51.49 | 18.66 | 9.29 |
| Upshur County | 5 | 6 | 9 | 13 | 5 | 12.58 | 14.91 | 22.29 | 31.81 | 12.11 |
| Upton County | 1 | 8 | 3 | 2 | 0 | 29.55 | 229.95 | 82.19 | 54.1 | 0 |
| Uvalde County | 8 | 5 | 3 | 2 | 15 | 29.8 | 18.48 | 11.14 | 7.38 | 55.29 |
| Val Verde County | 8 | 4 | 8 | 3 | 1 | 16.32 | 8.2 | 16.36 | 6.13 | 2.03 |
| Van Zandt County | 22 | 10 | 12 | 18 | 15 | 42.05 | 18.96 | 22.47 | 33.1 | 27.18 |
| Victoria County | 13 | 13 | 17 | 13 | 15 | 14.44 | 14.29 | 18.46 | 14.07 | 16.29 |
| Walker County | 11 | 22 | 9 | 25 | 23 | 15.84 | 31.43 | 12.73 | 34.87 | 31.84 |
| Waller County | 19 | 11 | 7 | 7 | 24 | 41.84 | 23.51 | 14.39 | 13.98 | 46.78 |
| Ward County | 6 | 19 | 10 | 9 | 12 | 53.52 | 164.1 | 85.92 | 77.66 | 104.6 |
| Washington County | 4 | 13 | 11 | 13 | 9 | 11.7 | 37.78 | 31.55 | 37.33 | 25.68 |
| Webb County | 29 | 16 | 21 | 47 | 25 | 10.99 | 5.99 | 7.78 | 17.25 | 9.1 |
| Wharton County | 10 | 9 | 14 | 6 | 6 | 24.33 | 21.91 | 33.83 | 14.41 | 14.3 |
| Wheeler County | 2 | 6 | 2 | 3 | 9 | 34.97 | 105.23 | 35.29 | 54.07 | 167.97 |
| Wichita County | 15 | 16 | 7 | 15 | 13 | 11.35 | 12.07 | 5.35 | 11.42 | 9.85 |
| Wilbarger County | 2 | 5 | 6 | 7 | 5 | 15.17 | 38.55 | 45.98 | 54.29 | 39.17 |
| Willacy County | 2 | 2 | 2 | 11 | 5 | 9.08 | 9.11 | 9.14 | 50.55 | 23.17 |
| Williamson County | 23 | 47 | 44 | 45 | 38 | 4.89 | 9.62 | 8.67 | 8.53 | 6.94 |
| Wilson County | 10 | 14 | 4 | 7 | 4 | 22.11 | 30.34 | 8.48 | 14.53 | 8.11 |
| Winkler County | 5 | 4 | 8 | 2 | 6 | 65.52 | 51.18 | 100.06 | 25.41 | 79.22 |
| Wise County | 10 | 14 | 21 | 19 | 21 | 16.39 | 22.68 | 33.41 | 29.47 | 31.73 |
| Wood County | 11 | 12 | 12 | 7 | 10 | 25.94 | 28.03 | 27.76 | 15.97 | 22.57 |
| Yoakum County | 2 | 4 | 1 | 3 | 2 | 24.37 | 47.72 | 11.6 | 34.78 | 23.34 |
| Young County | 2 | 3 | 2 | 4 | 4 | 10.89 | 16.42 | 11.02 | 22.13 | 22.25 |
| Zapata County | 2 | 0 | 4 | 2 | 0 | 13.9 | 0 | 27.56 | 13.84 | 0 |
| Zavala County | 3 | 5 | 6 | 6 | 2 | 24.62 | 40.86 | 48.8 | 49.62 | 16.74 |
Traffic Fatalities: Rural vs Urban
Usually, more fatalities happen in rural areas because there aren’t as many EMS services near a crash site.
| Area | 2008 | 2009 | 2010 | 2011 | 2012 | 2013 | 2014 | 2015 | 2016 | 2017 |
|---|---|---|---|---|---|---|---|---|---|---|
| Rural | 1,761 | 1,652 | 1,462 | 1,464 | 1,696 | 1,663 | 1,780 | 1,622 | 1,590 | 1,504 |
| Urban | 1,629 | 1,437 | 1,546 | 1,582 | 1,711 | 1,726 | 1,750 | 1,948 | 2,205 | 2,205 |
| Unknown | 86 | 15 | 15 | 8 | 1 | 0 | 6 | 12 | 2 | 13 |
| Total | 3,476 | 3,104 | 3,023 | 3,054 | 3,408 | 3,389 | 3,536 | 3,582 | 3,797 | 3,722 |
But according to this table above, the fatality rates between urban and rural areas are about the same.
Fatalities by Person Type
Did person type or vehicle type have anything to do with the fatality rate?
| Person Type | 2013 | 2014 | 2015 | 2016 | 2017 | |
|---|---|---|---|---|---|---|
| Occupants | Passenger Car | 1,067 | 1,137 | 1,171 | 1,219 | 1,252 |
| Light Truck - Pickup | 606 | 693 | 626 | 636 | 588 | |
| Light Truck - Utility | 441 | 480 | 483 | 441 | 457 | |
| Light Truck - Van | 95 | 87 | 88 | 87 | 64 | |
| Light Truck - Other | 1 | 1 | 1 | 11 | 8 | |
| Large Truck | 111 | 114 | 100 | 109 | 129 | |
| Bus | 7 | 2 | 17 | 10 | 16 | |
| Other/Unknown Occupants | 23 | 21 | 23 | 27 | 31 | |
| Total Occupants | 2,351 | 2,535 | 2,509 | 2,540 | 2,545 | |
| Motorcyclists | Total Motorcyclists | 493 | 451 | 452 | 495 | 490 |
| Nonoccupants | Pedestrian | 480 | 479 | 549 | 675 | 607 |
| Bicyclist and Other Cyclist | 48 | 50 | 52 | 65 | 59 | |
| Other/Unknown Nonoccupants | 17 | 21 | 20 | 22 | 21 | |
| Total Nonoccupants | 545 | 550 | 621 | 762 | 687 | |
| Total | Total | 3,389 | 3,536 | 3,582 | 3,797 | 3,722 |
Fatalities by Crash Type
What about crash type? Did more fatalities occur when a certain circumstance occurred at the same time?
| Crash Type | 2013 | 2014 | 2015 | 2016 | 2017 |
|---|---|---|---|---|---|
| Total Fatalities (All Crashes) | 3,389 | 3,536 | 3,582 | 3,797 | 3,722 |
| (1) Single Vehicle | 1,815 | 1,913 | 1,848 | 1,982 | 1,914 |
| (2) Involving a Large Truck | 535 | 553 | 567 | 558 | 649 |
| (3) Involving Speeding | 1,181 | 1,277 | 1,125 | 1,076 | 1,029 |
| (4) Involving a Rollover | 1,011 | 1,091 | 983 | 1,020 | 942 |
| (5) Involving a Roadway Departure | 1,836 | 1,912 | 1,800 | 1,860 | 1,832 |
| (6) Involving an Intersection (or Intersection Related) | 668 | 667 | 709 | 719 | 724 |
Most of the fatal crashes for the years 2008-17 were single-car crashes and involved some kind of roadway departure.
Five-Year Fatality Trend For The Top 10 Counties
Below is a table showing the five-year fatality trend for the top 10 counties in Texas.
| County | 2013 | 2014 | 2015 | 2016 | 2017 |
|---|---|---|---|---|---|
| Harris County | 369 | 417 | 391 | 447 | 456 |
| Dallas County | 225 | 238 | 259 | 315 | 282 |
| Tarrant County | 144 | 145 | 157 | 167 | 180 |
| Bexar County | 189 | 184 | 189 | 226 | 164 |
| Travis County | 112 | 95 | 145 | 120 | 120 |
| Collin County | 41 | 47 | 37 | 50 | 68 |
| Hidalgo County | 65 | 65 | 67 | 75 | 60 |
| El Paso County | 60 | 66 | 62 | 81 | 58 |
| Bell County | 36 | 34 | 40 | 42 | 57 |
| Montgomery County | 51 | 53 | 60 | 76 | 54 |
Harris County had the most fatalities over a span of five years.
Fatalities Involving Speeding by County
Speeding is another major cause of traffic fatalities.
| County | Fatalities 2013 | 2014 | 2015 | 2016 | 2017 | Fatalities Per 100K Population 2013 | 2014 | 2015 | 2016 | 2017 |
|---|---|---|---|---|---|---|---|---|---|---|
| Anderson County | 4 | 4 | 3 | 5 | 3 | 6.9 | 6.92 | 5.2 | 8.69 | 5.2 |
| Andrews County | 2 | 1 | 2 | 0 | 2 | 11.91 | 5.73 | 11.05 | 0 | 11.29 |
| Angelina County | 3 | 10 | 4 | 1 | 7 | 3.43 | 11.42 | 4.55 | 1.14 | 7.97 |
| Aransas County | 2 | 1 | 0 | 1 | 0 | 8.37 | 4.07 | 0 | 3.96 | 0 |
| Archer County | 1 | 1 | 0 | 1 | 0 | 11.37 | 11.32 | 0 | 11.4 | 0 |
| Armstrong County | 3 | 0 | 0 | 0 | 0 | 154.64 | 0 | 0 | 0 | 0 |
| Atascosa County | 0 | 3 | 7 | 1 | 3 | 0 | 6.29 | 14.48 | 2.05 | 6.12 |
| Austin County | 2 | 6 | 4 | 0 | 1 | 6.98 | 20.73 | 13.58 | 0 | 3.36 |
| Bailey County | 2 | 0 | 0 | 0 | 0 | 28.18 | 0 | 0 | 0 | 0 |
| Bandera County | 6 | 5 | 3 | 1 | 2 | 29.18 | 24.02 | 14.19 | 4.61 | 8.95 |
| Bastrop County | 8 | 5 | 4 | 4 | 5 | 10.54 | 6.42 | 4.99 | 4.83 | 5.9 |
| Baylor County | 1 | 1 | 1 | 0 | 0 | 27.96 | 28.03 | 27.4 | 0 | 0 |
| Bee County | 2 | 1 | 1 | 2 | 1 | 6.1 | 3.05 | 3.07 | 6.09 | 3.07 |
| Bell County | 15 | 20 | 15 | 11 | 20 | 4.59 | 6.06 | 4.46 | 3.22 | 5.75 |
| Bexar County | 70 | 69 | 73 | 60 | 57 | 3.84 | 3.71 | 3.85 | 3.11 | 2.91 |
| Blanco County | 4 | 5 | 0 | 1 | 0 | 37.61 | 46.28 | 0 | 8.82 | 0 |
| Borden County | 1 | 1 | 1 | 1 | 0 | 154.8 | 150.15 | 152.44 | 151.52 | 0 |
| Bosque County | 1 | 3 | 0 | 1 | 0 | 5.6 | 16.93 | 0 | 5.55 | 0 |
| Bowie County | 12 | 7 | 2 | 8 | 2 | 12.84 | 7.49 | 2.14 | 8.52 | 2.13 |
| Brazoria County | 13 | 12 | 14 | 13 | 18 | 3.94 | 3.55 | 4.05 | 3.67 | 4.97 |
| Brazos County | 3 | 6 | 10 | 6 | 9 | 1.47 | 2.87 | 4.63 | 2.73 | 4.04 |
| Brewster County | 2 | 0 | 0 | 0 | 0 | 21.53 | 0 | 0 | 0 | 0 |
| Briscoe County | 0 | 0 | 0 | 1 | 0 | 0 | 0 | 0 | 67.29 | 0 |
| Brooks County | 6 | 1 | 1 | 0 | 0 | 82.63 | 13.78 | 13.82 | 0 | 0 |
| Brown County | 0 | 1 | 1 | 1 | 0 | 0 | 2.67 | 2.65 | 2.63 | 0 |
| Burleson County | 1 | 2 | 1 | 2 | 1 | 5.8 | 11.53 | 5.7 | 11.23 | 5.55 |
| Burnet County | 5 | 6 | 5 | 3 | 10 | 11.47 | 13.64 | 11.17 | 6.53 | 21.37 |
| Caldwell County | 1 | 4 | 4 | 5 | 6 | 2.55 | 10.08 | 9.91 | 12.16 | 14.17 |
| Calhoun County | 1 | 1 | 0 | 0 | 0 | 4.6 | 4.59 | 0 | 0 | 0 |
| Callahan County | 5 | 2 | 1 | 1 | 6 | 37.05 | 14.82 | 7.36 | 7.26 | 43.02 |
| Cameron County | 10 | 10 | 8 | 9 | 10 | 2.4 | 2.39 | 1.91 | 2.13 | 2.36 |
| Camp County | 2 | 1 | 0 | 0 | 0 | 16.08 | 7.92 | 0 | 0 | 0 |
| Carson County | 0 | 0 | 1 | 0 | 1 | 0 | 0 | 16.65 | 0 | 16.58 |
| Cass County | 2 | 0 | 6 | 3 | 2 | 6.62 | 0 | 19.91 | 9.97 | 6.66 |
| Castro County | 1 | 0 | 0 | 0 | 0 | 12.37 | 0 | 0 | 0 | 0 |
| Chambers County | 3 | 8 | 5 | 3 | 0 | 8.03 | 20.9 | 12.8 | 7.45 | 0 |
| Cherokee County | 3 | 3 | 1 | 5 | 5 | 5.87 | 5.86 | 1.94 | 9.63 | 9.57 |
| Childress County | 1 | 0 | 0 | 0 | 1 | 14.17 | 0 | 0 | 0 | 14.15 |
| Clay County | 2 | 1 | 0 | 0 | 0 | 19.13 | 9.64 | 0 | 0 | 0 |
| Cochran County | 0 | 0 | 0 | 0 | 0 | 0 | 0 | 0 | 0 | 0 |
| Coke County | 0 | 0 | 0 | 0 | 0 | 0 | 0 | 0 | 0 | 0 |
| Coleman County | 0 | 1 | 0 | 2 | 0 | 0 | 11.88 | 0 | 23.75 | 0 |
| Collin County | 12 | 21 | 19 | 16 | 37 | 1.4 | 2.37 | 2.08 | 1.7 | 3.82 |
| Collingsworth County | 0 | 0 | 0 | 0 | 0 | 0 | 0 | 0 | 0 | 0 |
| Colorado County | 7 | 1 | 8 | 1 | 1 | 33.8 | 4.83 | 38.26 | 4.76 | 4.71 |
| Comal County | 9 | 5 | 6 | 14 | 4 | 7.59 | 4.06 | 4.66 | 10.44 | 2.84 |
| Comanche County | 2 | 1 | 0 | 4 | 1 | 14.77 | 7.43 | 0 | 29.58 | 7.37 |
| Concho County | 0 | 0 | 0 | 0 | 0 | 0 | 0 | 0 | 0 | 0 |
| Cooke County | 2 | 7 | 5 | 2 | 2 | 5.2 | 18.09 | 12.8 | 5.1 | 5.01 |
| Coryell County | 3 | 1 | 3 | 4 | 1 | 3.91 | 1.31 | 3.94 | 5.34 | 1.33 |
| Cottle County | 0 | 0 | 0 | 0 | 0 | 0 | 0 | 0 | 0 | 0 |
| Crane County | 1 | 1 | 0 | 0 | 0 | 21.18 | 20.38 | 0 | 0 | 0 |
| Crockett County | 2 | 0 | 2 | 3 | 2 | 53.18 | 0 | 53.59 | 82.12 | 56.12 |
| Crosby County | 0 | 0 | 2 | 4 | 1 | 0 | 0 | 33.81 | 67.6 | 16.95 |
| Culberson County | 1 | 1 | 5 | 0 | 2 | 43.38 | 43.86 | 222.12 | 0 | 89.65 |
| Dallam County | 0 | 1 | 0 | 0 | 0 | 0 | 13.88 | 0 | 0 | 0 |
| Dallas County | 92 | 118 | 93 | 114 | 102 | 3.7 | 4.69 | 3.64 | 4.41 | 3.9 |
| Dawson County | 0 | 0 | 2 | 0 | 0 | 0 | 0 | 15.4 | 0 | 0 |
| Deaf Smith County | 1 | 1 | 0 | 1 | 3 | 5.22 | 5.24 | 0 | 5.31 | 15.93 |
| Delta County | 0 | 0 | 0 | 1 | 0 | 0 | 0 | 0 | 19.43 | 0 |
| Denton County | 17 | 21 | 12 | 13 | 16 | 2.33 | 2.79 | 1.54 | 1.61 | 1.91 |
| Dewitt County | 2 | 3 | 1 | 1 | 0 | 9.81 | 14.62 | 4.85 | 4.85 | 0 |
| Dickens County | 0 | 0 | 0 | 1 | 0 | 0 | 0 | 0 | 45.43 | 0 |
| Dimmit County | 2 | 7 | 2 | 0 | 1 | 18.34 | 63.52 | 18.21 | 0 | 9.6 |
| Donley County | 0 | 3 | 0 | 1 | 0 | 0 | 85.67 | 0 | 29.48 | 0 |
| Duval County | 1 | 0 | 0 | 0 | 0 | 8.63 | 0 | 0 | 0 | 0 |
| Eastland County | 7 | 4 | 4 | 0 | 2 | 38.3 | 21.93 | 22.03 | 0 | 10.86 |
| Ector County | 13 | 10 | 14 | 7 | 14 | 8.69 | 6.47 | 8.76 | 4.44 | 8.91 |
| Edwards County | 0 | 0 | 3 | 1 | 0 | 0 | 0 | 157.07 | 52.14 | 0 |
| El Paso County | 20 | 28 | 21 | 10 | 13 | 2.41 | 3.36 | 2.52 | 1.19 | 1.55 |
| Ellis County | 8 | 11 | 7 | 12 | 7 | 5.13 | 6.91 | 4.29 | 7.13 | 4.03 |
| Erath County | 1 | 8 | 3 | 4 | 3 | 2.51 | 19.73 | 7.28 | 9.65 | 7.15 |
| Falls County | 1 | 1 | 0 | 1 | 0 | 5.8 | 5.81 | 0 | 5.77 | 0 |
| Fannin County | 1 | 1 | 1 | 4 | 7 | 2.98 | 2.97 | 2.99 | 11.82 | 20.32 |
| Fayette County | 5 | 2 | 3 | 0 | 7 | 20.23 | 8.07 | 12.02 | 0 | 27.7 |
| Fisher County | 0 | 3 | 2 | 1 | 0 | 0 | 77.46 | 51.67 | 25.77 | 0 |
| Floyd County | 0 | 2 | 0 | 1 | 0 | 0 | 33.64 | 0 | 17.02 | 0 |
| Foard County | 1 | 0 | 0 | 1 | 0 | 77.64 | 0 | 0 | 82.58 | 0 |
| Fort Bend County | 20 | 11 | 9 | 6 | 6 | 3.07 | 1.61 | 1.26 | 0.81 | 0.78 |
| Franklin County | 0 | 2 | 2 | 3 | 0 | 0 | 18.93 | 18.88 | 28.15 | 0 |
| Freestone County | 2 | 2 | 1 | 5 | 0 | 10.21 | 10.18 | 5.07 | 25.45 | 0 |
| Frio County | 4 | 0 | 6 | 0 | 0 | 21.76 | 0 | 31.15 | 0 | 0 |
| Gaines County | 3 | 2 | 3 | 1 | 1 | 15.96 | 10.35 | 14.84 | 4.88 | 4.85 |
| Galveston County | 11 | 17 | 12 | 13 | 10 | 3.59 | 5.42 | 3.73 | 3.95 | 2.98 |
| Garza County | 1 | 3 | 0 | 1 | 0 | 15.69 | 46.82 | 0 | 15.52 | 0 |
| Gillespie County | 1 | 2 | 3 | 6 | 2 | 3.95 | 7.85 | 11.56 | 22.81 | 7.51 |
| Glasscock County | 0 | 0 | 3 | 1 | 0 | 0 | 0 | 219.14 | 74.07 | 0 |
| Goliad County | 0 | 2 | 1 | 0 | 0 | 0 | 26.65 | 13.32 | 0 | 0 |
| Gonzales County | 5 | 8 | 3 | 2 | 1 | 24.83 | 39.3 | 14.61 | 9.59 | 4.79 |
| Gray County | 0 | 2 | 2 | 0 | 0 | 0 | 8.53 | 8.6 | 0 | 0 |
| Grayson County | 11 | 7 | 4 | 8 | 8 | 8.99 | 5.67 | 3.19 | 6.24 | 6.1 |
| Gregg County | 5 | 5 | 14 | 6 | 6 | 4.06 | 4.06 | 11.3 | 4.85 | 4.86 |
| Grimes County | 2 | 0 | 4 | 1 | 2 | 7.46 | 0 | 14.64 | 3.63 | 7.12 |
| Guadalupe County | 5 | 3 | 8 | 10 | 1 | 3.5 | 2.04 | 5.31 | 6.47 | 0.63 |
| Hale County | 0 | 4 | 2 | 1 | 1 | 0 | 11.6 | 5.87 | 2.92 | 2.93 |
| Hall County | 0 | 0 | 0 | 0 | 0 | 0 | 0 | 0 | 0 | 0 |
| Hamilton County | 2 | 2 | 1 | 0 | 2 | 24.31 | 24.54 | 12.39 | 0 | 23.75 |
| Hansford County | 0 | 1 | 0 | 0 | 1 | 0 | 18.07 | 0 | 0 | 18.36 |
| Hardeman County | 0 | 3 | 0 | 2 | 1 | 0 | 75.23 | 0 | 50.11 | 25.04 |
| Hardin County | 7 | 4 | 3 | 2 | 2 | 12.66 | 7.21 | 5.38 | 3.55 | 3.5 |
| Harris County | 121 | 136 | 107 | 135 | 105 | 2.78 | 3.05 | 2.35 | 2.92 | 2.26 |
| Harrison County | 6 | 3 | 9 | 7 | 6 | 9.06 | 4.5 | 13.48 | 10.49 | 9 |
| Hartley County | 1 | 1 | 3 | 0 | 0 | 16.69 | 16.56 | 52.87 | 0 | 0 |
| Haskell County | 1 | 3 | 1 | 0 | 1 | 16.93 | 51.73 | 17.19 | 0 | 17.4 |
| Hays County | 10 | 8 | 10 | 7 | 8 | 5.68 | 4.33 | 5.14 | 3.43 | 3.73 |
| Hemphill County | 0 | 0 | 0 | 0 | 0 | 0 | 0 | 0 | 0 | 0 |
| Henderson County | 3 | 2 | 4 | 2 | 3 | 3.82 | 2.52 | 5.03 | 2.5 | 3.7 |
| Hidalgo County | 26 | 29 | 29 | 24 | 18 | 3.18 | 3.5 | 3.45 | 2.82 | 2.09 |
| Hill County | 6 | 5 | 5 | 4 | 3 | 17.22 | 14.38 | 14.35 | 11.37 | 8.37 |
| Hockley County | 2 | 5 | 1 | 2 | 1 | 8.55 | 21.31 | 4.29 | 8.66 | 4.33 |
| Hood County | 2 | 5 | 0 | 3 | 4 | 3.78 | 9.29 | 0 | 5.29 | 6.86 |
| Hopkins County | 2 | 2 | 5 | 4 | 7 | 5.67 | 5.6 | 13.9 | 11.05 | 19.18 |
| Houston County | 1 | 3 | 2 | 7 | 2 | 4.38 | 13.16 | 8.8 | 30.58 | 8.69 |
| Howard County | 6 | 1 | 6 | 0 | 3 | 16.59 | 2.74 | 16.16 | 0 | 8.32 |
| Hudspeth County | 3 | 4 | 3 | 6 | 5 | 89.9 | 122.77 | 87.31 | 147.31 | 113.43 |
| Hunt County | 1 | 7 | 1 | 6 | 8 | 1.14 | 7.9 | 1.12 | 6.53 | 8.52 |
| Hutchinson County | 1 | 1 | 1 | 3 | 0 | 4.57 | 4.57 | 4.59 | 13.91 | 0 |
| Irion County | 0 | 4 | 2 | 0 | 0 | 0 | 254.13 | 129.62 | 0 | 0 |
| Jack County | 3 | 1 | 0 | 0 | 0 | 33.71 | 11.29 | 0 | 0 | 0 |
| Jackson County | 1 | 1 | 1 | 1 | 1 | 6.85 | 6.79 | 6.76 | 6.73 | 6.75 |
| Jasper County | 6 | 1 | 4 | 2 | 3 | 16.85 | 2.82 | 11.35 | 5.65 | 8.44 |
| Jeff Davis County | 1 | 2 | 0 | 0 | 1 | 44.82 | 90.09 | 0 | 0 | 43.86 |
| Jefferson County | 9 | 9 | 9 | 9 | 7 | 3.56 | 3.56 | 3.53 | 3.52 | 2.73 |
| Jim Hogg County | 1 | 0 | 0 | 0 | 0 | 19.01 | 0 | 0 | 0 | 0 |
| Jim Wells County | 4 | 2 | 4 | 1 | 1 | 9.6 | 4.82 | 9.65 | 2.43 | 2.45 |
| Johnson County | 9 | 13 | 10 | 6 | 6 | 5.82 | 8.29 | 6.27 | 3.68 | 3.59 |
| Jones County | 2 | 2 | 0 | 1 | 4 | 9.98 | 10.08 | 0 | 5 | 20.02 |
| Karnes County | 5 | 2 | 2 | 3 | 3 | 33.96 | 13.48 | 13.12 | 19.65 | 19.75 |
| Kaufman County | 2 | 6 | 4 | 5 | 9 | 1.85 | 5.41 | 3.5 | 4.24 | 7.32 |
| Kendall County | 6 | 0 | 7 | 2 | 2 | 16.15 | 0 | 17.51 | 4.77 | 4.54 |
| Kenedy County | 1 | 0 | 0 | 0 | 0 | 229.89 | 0 | 0 | 0 | 0 |
| Kent County | 0 | 0 | 0 | 0 | 0 | 0 | 0 | 0 | 0 | 0 |
| Kerr County | 4 | 7 | 3 | 5 | 0 | 8.04 | 13.92 | 5.91 | 9.75 | 0 |
| Kimble County | 0 | 0 | 0 | 6 | 1 | 0 | 0 | 0 | 135.5 | 22.68 |
| King County | 0 | 0 | 1 | 0 | 0 | 0 | 0 | 352.11 | 0 | 0 |
| Kinney County | 1 | 0 | 0 | 1 | 0 | 27.54 | 0 | 0 | 27.47 | 0 |
| Kleberg County | 1 | 2 | 1 | 1 | 1 | 3.12 | 6.28 | 3.18 | 3.19 | 3.22 |
| Knox County | 1 | 0 | 1 | 0 | 0 | 26.87 | 0 | 26.37 | 0 | 0 |
| La Salle County | 4 | 5 | 1 | 1 | 2 | 53.76 | 66.85 | 13.08 | 13.13 | 26.37 |
| Lamar County | 3 | 3 | 2 | 4 | 1 | 6.11 | 6.07 | 4.05 | 8.07 | 2.02 |
| Lamb County | 3 | 0 | 1 | 1 | 1 | 21.97 | 0 | 7.54 | 7.56 | 7.57 |
| Lampasas County | 0 | 1 | 1 | 1 | 4 | 0 | 4.97 | 4.9 | 4.84 | 19.02 |
| Lavaca County | 1 | 1 | 4 | 0 | 1 | 5.09 | 5.06 | 20.08 | 0 | 4.98 |
| Lee County | 2 | 3 | 6 | 5 | 0 | 12.08 | 18.04 | 35.54 | 29.42 | 0 |
| Leon County | 6 | 2 | 3 | 1 | 0 | 36.09 | 11.95 | 17.61 | 5.82 | 0 |
| Liberty County | 4 | 7 | 5 | 4 | 9 | 5.21 | 8.97 | 6.29 | 4.92 | 10.76 |
| Limestone County | 0 | 1 | 4 | 2 | 1 | 0 | 4.26 | 17.06 | 8.5 | 4.25 |
| Lipscomb County | 0 | 0 | 0 | 0 | 0 | 0 | 0 | 0 | 0 | 0 |
| Live Oak County | 1 | 6 | 4 | 3 | 1 | 8.46 | 49.82 | 32.9 | 24.95 | 8.21 |
| Llano County | 2 | 2 | 0 | 3 | 1 | 10.26 | 10.18 | 0 | 14.58 | 4.71 |
| Loving County | 0 | 0 | 0 | 1 | 0 | 0 | 0 | 0 | 869.57 | 0 |
| Lubbock County | 18 | 17 | 8 | 11 | 12 | 6.22 | 5.77 | 2.68 | 3.64 | 3.93 |
| Lynn County | 1 | 0 | 2 | 1 | 0 | 17.46 | 0 | 34.81 | 17.26 | 0 |
| Madison County | 0 | 1 | 2 | 4 | 0 | 0 | 7.22 | 14.35 | 28.38 | 0 |
| Marion County | 3 | 0 | 1 | 1 | 3 | 29.2 | 0 | 9.87 | 9.91 | 29.81 |
| Martin County | 1 | 2 | 2 | 0 | 1 | 18.96 | 36.55 | 35.24 | 0 | 17.77 |
| Mason County | 0 | 0 | 0 | 0 | 1 | 0 | 0 | 0 | 0 | 23.69 |
| Matagorda County | 3 | 2 | 8 | 2 | 2 | 8.22 | 5.48 | 21.76 | 5.39 | 5.43 |
| Maverick County | 1 | 5 | 0 | 2 | 1 | 1.77 | 8.77 | 0 | 3.45 | 1.72 |
| Mcculloch County | 0 | 1 | 3 | 1 | 0 | 0 | 12.27 | 36.35 | 12.31 | 0 |
| Mclennan County | 12 | 13 | 12 | 7 | 14 | 4.97 | 5.35 | 4.89 | 2.83 | 5.57 |
| Mcmullen County | 0 | 0 | 0 | 0 | 0 | 0 | 0 | 0 | 0 | 0 |
| Medina County | 5 | 0 | 3 | 4 | 10 | 10.58 | 0 | 6.2 | 8.13 | 19.97 |
| Menard County | 1 | 0 | 0 | 0 | 1 | 46.84 | 0 | 0 | 0 | 47.08 |
| Midland County | 14 | 20 | 12 | 10 | 14 | 9.19 | 12.77 | 7.41 | 6.12 | 8.48 |
| Milam County | 0 | 4 | 3 | 1 | 5 | 0 | 16.57 | 12.31 | 4.04 | 19.96 |
| Mills County | 0 | 3 | 0 | 1 | 0 | 0 | 61.64 | 0 | 20.43 | 0 |
| Mitchell County | 1 | 1 | 1 | 0 | 0 | 11.11 | 11.03 | 11.29 | 0 | 0 |
| Montague County | 1 | 3 | 1 | 2 | 0 | 5.16 | 15.48 | 5.19 | 10.29 | 0 |
| Montgomery County | 21 | 25 | 18 | 21 | 12 | 4.21 | 4.84 | 3.36 | 3.79 | 2.1 |
| Moore County | 4 | 1 | 0 | 0 | 0 | 18.06 | 4.54 | 0 | 0 | 0 |
| Morris County | 2 | 3 | 1 | 2 | 2 | 15.77 | 23.78 | 8.07 | 16.01 | 16.04 |
| Motley County | 1 | 0 | 0 | 0 | 0 | 83.89 | 0 | 0 | 0 | 0 |
| Nacogdoches County | 6 | 3 | 6 | 5 | 1 | 9.21 | 4.6 | 9.17 | 7.61 | 1.52 |
| Navarro County | 5 | 3 | 1 | 1 | 4 | 10.41 | 6.26 | 2.08 | 2.07 | 8.21 |
| Newton County | 0 | 1 | 1 | 1 | 0 | 0 | 6.99 | 7.06 | 7.05 | 0 |
| Nolan County | 4 | 5 | 0 | 4 | 7 | 26.57 | 33.08 | 0 | 26.72 | 47.39 |
| Nueces County | 15 | 12 | 10 | 12 | 9 | 4.25 | 3.37 | 2.77 | 3.32 | 2.49 |
| Ochiltree County | 1 | 0 | 1 | 1 | 0 | 9.37 | 0 | 9.35 | 9.71 | 0 |
| Oldham County | 2 | 0 | 4 | 0 | 4 | 95.74 | 0 | 193.8 | 0 | 189.21 |
| Orange County | 2 | 10 | 6 | 5 | 7 | 2.41 | 12.01 | 7.15 | 5.92 | 8.23 |
| Palo Pinto County | 2 | 3 | 3 | 4 | 2 | 7.18 | 10.71 | 10.73 | 14.22 | 7 |
| Panola County | 6 | 6 | 6 | 6 | 1 | 25.22 | 25.27 | 25.36 | 25.6 | 4.3 |
| Parker County | 7 | 5 | 6 | 11 | 8 | 5.84 | 4.09 | 4.78 | 8.54 | 5.99 |
| Parmer County | 0 | 0 | 1 | 0 | 2 | 0 | 0 | 10.2 | 0 | 20.32 |
| Pecos County | 0 | 3 | 4 | 0 | 2 | 0 | 18.94 | 24.97 | 0 | 12.79 |
| Polk County | 4 | 4 | 3 | 4 | 4 | 8.79 | 8.73 | 6.44 | 8.38 | 8.14 |
| Potter County | 8 | 11 | 8 | 7 | 13 | 6.55 | 9.02 | 6.6 | 5.81 | 10.79 |
| Presidio County | 0 | 1 | 0 | 1 | 0 | 0 | 13.91 | 0 | 13.95 | 0 |
| Rains County | 1 | 1 | 0 | 0 | 0 | 9.07 | 9.09 | 0 | 0 | 0 |
| Randall County | 7 | 5 | 7 | 0 | 1 | 5.52 | 3.88 | 5.37 | 0 | 0.74 |
| Reagan County | 1 | 2 | 0 | 0 | 1 | 27.55 | 52.8 | 0 | 0 | 26.95 |
| Real County | 2 | 0 | 2 | 1 | 0 | 60.26 | 0 | 60.66 | 29.44 | 0 |
| Red River County | 1 | 0 | 1 | 4 | 1 | 8 | 0 | 8.09 | 32.74 | 8.18 |
| Reeves County | 8 | 4 | 3 | 0 | 3 | 56.38 | 27.57 | 20.13 | 0 | 19.63 |
| Refugio County | 4 | 4 | 1 | 0 | 1 | 55 | 54.39 | 13.66 | 0 | 13.84 |
| Roberts County | 0 | 3 | 0 | 0 | 0 | 0 | 328.23 | 0 | 0 | 0 |
| Robertson County | 2 | 0 | 0 | 1 | 2 | 12.18 | 0 | 0 | 5.93 | 11.63 |
| Rockwall County | 3 | 0 | 1 | 2 | 1 | 3.54 | 0 | 1.11 | 2.14 | 1.03 |
| Runnels County | 0 | 1 | 0 | 2 | 0 | 0 | 9.74 | 0 | 19.5 | 0 |
| Rusk County | 7 | 0 | 8 | 6 | 4 | 13.12 | 0 | 15.11 | 11.35 | 7.57 |
| Sabine County | 2 | 1 | 1 | 0 | 1 | 19.19 | 9.59 | 9.57 | 0 | 9.56 |
| San Augustine County | 0 | 1 | 2 | 0 | 3 | 0 | 11.8 | 23.98 | 0 | 36.35 |
| San Jacinto County | 3 | 3 | 1 | 4 | 0 | 11.22 | 11.09 | 3.65 | 14.41 | 0 |
| San Patricio County | 4 | 6 | 3 | 0 | 2 | 6.05 | 9 | 4.47 | 0 | 2.98 |
| San Saba County | 1 | 1 | 0 | 1 | 0 | 17.57 | 17.19 | 0 | 17.03 | 0 |
| Schleicher County | 3 | 0 | 0 | 0 | 0 | 94.07 | 0 | 0 | 0 | 0 |
| Scurry County | 2 | 2 | 0 | 0 | 1 | 11.58 | 11.49 | 0 | 0 | 5.87 |
| Shackelford County | 1 | 2 | 0 | 0 | 0 | 29.59 | 60.17 | 0 | 0 | 0 |
| Shelby County | 2 | 2 | 1 | 3 | 1 | 7.7 | 7.79 | 3.92 | 11.64 | 3.92 |
| Sherman County | 0 | 0 | 0 | 0 | 0 | 0 | 0 | 0 | 0 | 0 |
| Smith County | 11 | 18 | 25 | 9 | 16 | 5.08 | 8.2 | 11.24 | 3.99 | 7.03 |
| Somervell County | 1 | 2 | 1 | 1 | 3 | 11.68 | 23.38 | 11.61 | 11.52 | 33.92 |
| Starr County | 4 | 2 | 1 | 0 | 1 | 6.42 | 3.18 | 1.57 | 0 | 1.55 |
| Stephens County | 2 | 1 | 0 | 0 | 1 | 21.37 | 10.71 | 0 | 0 | 10.71 |
| Sterling County | 0 | 1 | 1 | 0 | 0 | 0 | 74.91 | 75.13 | 0 | 0 |
| Stonewall County | 0 | 0 | 0 | 0 | 0 | 0 | 0 | 0 | 0 | 0 |
| Sutton County | 4 | 1 | 1 | 1 | 0 | 100.48 | 25.26 | 25.67 | 25.87 | 0 |
| Swisher County | 1 | 0 | 0 | 1 | 0 | 12.96 | 0 | 0 | 13.44 | 0 |
| Tarrant County | 64 | 71 | 60 | 53 | 48 | 3.35 | 3.65 | 3.02 | 2.62 | 2.34 |
| Taylor County | 7 | 7 | 6 | 2 | 6 | 5.23 | 5.19 | 4.41 | 1.47 | 4.4 |
| Terrell County | 1 | 0 | 0 | 0 | 0 | 112.23 | 0 | 0 | 0 | 0 |
| Terry County | 5 | 0 | 2 | 0 | 1 | 39.39 | 0 | 15.68 | 0 | 7.86 |
| Throckmorton County | 0 | 0 | 0 | 0 | 2 | 0 | 0 | 0 | 0 | 130.98 |
| Titus County | 0 | 5 | 0 | 1 | 1 | 0 | 15.4 | 0 | 3.07 | 3.04 |
| Tom Green County | 6 | 8 | 6 | 3 | 2 | 5.23 | 6.87 | 5.1 | 2.55 | 1.69 |
| Travis County | 37 | 33 | 43 | 28 | 30 | 3.3 | 2.87 | 3.65 | 2.32 | 2.45 |
| Trinity County | 2 | 0 | 1 | 5 | 0 | 13.85 | 0 | 6.89 | 34.45 | 0 |
| Tyler County | 2 | 4 | 1 | 2 | 1 | 9.3 | 18.65 | 4.68 | 9.33 | 4.64 |
| Upshur County | 0 | 2 | 3 | 1 | 3 | 0 | 4.97 | 7.43 | 2.45 | 7.27 |
| Upton County | 1 | 2 | 2 | 1 | 0 | 29.55 | 57.49 | 54.79 | 27.05 | 0 |
| Uvalde County | 1 | 2 | 0 | 1 | 0 | 3.72 | 7.39 | 0 | 3.69 | 0 |
| Val Verde County | 2 | 1 | 1 | 1 | 0 | 4.08 | 2.05 | 2.04 | 2.04 | 0 |
| Van Zandt County | 6 | 4 | 3 | 7 | 6 | 11.47 | 7.58 | 5.62 | 12.87 | 10.87 |
| Victoria County | 3 | 5 | 5 | 1 | 6 | 3.33 | 5.5 | 5.43 | 1.08 | 6.52 |
| Walker County | 8 | 10 | 4 | 10 | 9 | 11.52 | 14.29 | 5.66 | 13.95 | 12.46 |
| Waller County | 6 | 4 | 1 | 2 | 8 | 13.21 | 8.55 | 2.06 | 4 | 15.59 |
| Ward County | 1 | 2 | 5 | 2 | 3 | 8.92 | 17.27 | 42.96 | 17.26 | 26.15 |
| Washington County | 0 | 4 | 4 | 2 | 2 | 0 | 11.62 | 11.47 | 5.74 | 5.71 |
| Webb County | 6 | 3 | 6 | 19 | 10 | 2.27 | 1.12 | 2.22 | 6.98 | 3.64 |
| Wharton County | 2 | 5 | 4 | 4 | 2 | 4.87 | 12.17 | 9.67 | 9.61 | 4.77 |
| Wheeler County | 0 | 3 | 0 | 1 | 3 | 0 | 52.61 | 0 | 18.02 | 55.99 |
| Wichita County | 4 | 3 | 4 | 4 | 4 | 3.03 | 2.26 | 3.06 | 3.05 | 3.03 |
| Wilbarger County | 0 | 1 | 2 | 2 | 1 | 0 | 7.71 | 15.33 | 15.51 | 7.83 |
| Willacy County | 1 | 0 | 0 | 5 | 1 | 4.54 | 0 | 0 | 22.98 | 4.63 |
| Williamson County | 7 | 9 | 11 | 14 | 7 | 1.49 | 1.84 | 2.17 | 2.65 | 1.28 |
| Wilson County | 2 | 6 | 1 | 4 | 0 | 4.42 | 13 | 2.12 | 8.3 | 0 |
| Winkler County | 0 | 0 | 1 | 0 | 0 | 0 | 0 | 12.51 | 0 | 0 |
| Wise County | 4 | 2 | 6 | 5 | 8 | 6.56 | 3.24 | 9.54 | 7.76 | 12.09 |
| Wood County | 6 | 4 | 1 | 2 | 1 | 14.15 | 9.34 | 2.31 | 4.56 | 2.26 |
| Yoakum County | 0 | 1 | 0 | 2 | 1 | 0 | 11.93 | 0 | 23.19 | 11.67 |
| Young County | 0 | 1 | 1 | 2 | 2 | 0 | 5.47 | 5.51 | 11.06 | 11.12 |
| Zapata County | 2 | 0 | 0 | 0 | 0 | 13.9 | 0 | 0 | 0 | 0 |
| Zavala County | 2 | 2 | 0 | 1 | 0 | 16.41 | 16.35 | 0 | 8.27 | 0 |
Fatalities in Crashes Involving an Alcohol-Impaired Driver (BAC = .08+) by County
In 2017, there were 1,468 alcohol-impaired traffic fatalities in the state of Texas.
Scroll through the list below and find your county to check drunk-driving related deaths.
| County | Fatalities 2013 | 2014 | 2015 | 2016 | 2017 | Fatalities Per 100K Population 2013 | 2014 | 2015 | 2016 | 2017 |
|---|---|---|---|---|---|---|---|---|---|---|
| Anderson County | 3 | 5 | 1 | 5 | 5 | 5.18 | 8.64 | 1.73 | 8.69 | 8.66 |
| Andrews County | 5 | 7 | 8 | 0 | 9 | 29.78 | 40.12 | 44.22 | 0 | 50.78 |
| Angelina County | 3 | 4 | 4 | 5 | 5 | 3.43 | 4.57 | 4.55 | 5.69 | 5.69 |
| Aransas County | 2 | 1 | 0 | 1 | 2 | 8.37 | 4.07 | 0 | 3.96 | 7.82 |
| Archer County | 3 | 4 | 0 | 2 | 0 | 34.12 | 45.27 | 0 | 22.79 | 0 |
| Armstrong County | 2 | 0 | 0 | 0 | 0 | 103.09 | 0 | 0 | 0 | 0 |
| Atascosa County | 2 | 9 | 5 | 2 | 0 | 4.26 | 18.87 | 10.34 | 4.11 | 0 |
| Austin County | 4 | 4 | 0 | 2 | 1 | 13.96 | 13.82 | 0 | 6.75 | 3.36 |
| Bailey County | 1 | 0 | 1 | 1 | 0 | 14.09 | 0 | 13.89 | 13.93 | 0 |
| Bandera County | 7 | 5 | 3 | 0 | 3 | 34.05 | 24.02 | 14.19 | 0 | 13.42 |
| Bastrop County | 7 | 6 | 8 | 14 | 12 | 9.22 | 7.7 | 9.98 | 16.92 | 14.16 |
| Baylor County | 1 | 2 | 2 | 0 | 0 | 27.96 | 56.07 | 54.81 | 0 | 0 |
| Bee County | 2 | 2 | 4 | 3 | 1 | 6.1 | 6.09 | 12.27 | 9.14 | 3.07 |
| Bell County | 16 | 18 | 16 | 13 | 24 | 4.89 | 5.45 | 4.76 | 3.81 | 6.9 |
| Bexar County | 88 | 74 | 82 | 95 | 71 | 4.83 | 3.98 | 4.33 | 4.93 | 3.63 |
| Blanco County | 2 | 5 | 1 | 5 | 1 | 18.8 | 46.28 | 9.06 | 44.09 | 8.6 |
| Borden County | 1 | 0 | 0 | 0 | 0 | 154.8 | 0 | 0 | 0 | 0 |
| Bosque County | 2 | 3 | 1 | 0 | 1 | 11.2 | 16.93 | 5.6 | 0 | 5.46 |
| Bowie County | 9 | 6 | 4 | 5 | 6 | 9.63 | 6.42 | 4.28 | 5.33 | 6.38 |
| Brazoria County | 16 | 12 | 18 | 23 | 17 | 4.85 | 3.55 | 5.21 | 6.5 | 4.69 |
| Brazos County | 3 | 5 | 9 | 6 | 10 | 1.47 | 2.4 | 4.17 | 2.73 | 4.49 |
| Brewster County | 1 | 1 | 1 | 0 | 0 | 10.76 | 10.93 | 10.95 | 0 | 0 |
| Briscoe County | 0 | 0 | 0 | 0 | 0 | 0 | 0 | 0 | 0 | 0 |
| Brooks County | 2 | 1 | 1 | 0 | 0 | 27.54 | 13.78 | 13.82 | 0 | 0 |
| Brown County | 0 | 1 | 4 | 3 | 1 | 0 | 2.67 | 10.61 | 7.88 | 2.63 |
| Burleson County | 1 | 1 | 2 | 4 | 4 | 5.8 | 5.76 | 11.39 | 22.46 | 22.21 |
| Burnet County | 4 | 7 | 5 | 1 | 9 | 9.17 | 15.92 | 11.17 | 2.18 | 19.23 |
| Caldwell County | 1 | 6 | 3 | 6 | 3 | 2.55 | 15.12 | 7.43 | 14.6 | 7.09 |
| Calhoun County | 2 | 3 | 0 | 1 | 1 | 9.2 | 13.76 | 0 | 4.56 | 4.6 |
| Callahan County | 3 | 0 | 0 | 4 | 1 | 22.23 | 0 | 0 | 29.03 | 7.17 |
| Cameron County | 20 | 12 | 9 | 17 | 18 | 4.8 | 2.87 | 2.15 | 4.03 | 4.25 |
| Camp County | 1 | 2 | 0 | 0 | 2 | 8.04 | 15.85 | 0 | 0 | 15.56 |
| Carson County | 0 | 1 | 1 | 1 | 1 | 0 | 16.58 | 16.65 | 16.37 | 16.58 |
| Cass County | 1 | 0 | 5 | 1 | 6 | 3.31 | 0 | 16.59 | 3.32 | 19.99 |
| Castro County | 1 | 2 | 0 | 0 | 0 | 12.37 | 25.29 | 0 | 0 | 0 |
| Chambers County | 5 | 7 | 3 | 7 | 2 | 13.39 | 18.28 | 7.68 | 17.38 | 4.83 |
| Cherokee County | 6 | 2 | 2 | 2 | 7 | 11.74 | 3.91 | 3.88 | 3.85 | 13.4 |
| Childress County | 1 | 0 | 0 | 1 | 1 | 14.17 | 0 | 0 | 14.09 | 14.15 |
| Clay County | 2 | 0 | 0 | 0 | 2 | 19.13 | 0 | 0 | 0 | 19.19 |
| Cochran County | 0 | 0 | 0 | 0 | 0 | 0 | 0 | 0 | 0 | 0 |
| Coke County | 0 | 3 | 2 | 1 | 1 | 0 | 93.31 | 62.02 | 30.65 | 30.25 |
| Coleman County | 0 | 2 | 0 | 1 | 0 | 0 | 23.76 | 0 | 11.88 | 0 |
| Collin County | 15 | 21 | 15 | 23 | 25 | 1.75 | 2.37 | 1.64 | 2.44 | 2.58 |
| Collingsworth County | 0 | 0 | 3 | 0 | 0 | 0 | 0 | 99.67 | 0 | 0 |
| Colorado County | 4 | 1 | 6 | 1 | 2 | 19.32 | 4.83 | 28.69 | 4.76 | 9.42 |
| Comal County | 9 | 6 | 7 | 10 | 7 | 7.59 | 4.87 | 5.44 | 7.45 | 4.96 |
| Comanche County | 0 | 1 | 1 | 1 | 1 | 0 | 7.43 | 7.48 | 7.4 | 7.37 |
| Concho County | 1 | 0 | 0 | 0 | 1 | 24.43 | 0 | 0 | 0 | 36.81 |
| Cooke County | 2 | 5 | 4 | 1 | 2 | 5.2 | 12.92 | 10.24 | 2.55 | 5.01 |
| Coryell County | 2 | 3 | 5 | 4 | 3 | 2.6 | 3.94 | 6.56 | 5.34 | 4 |
| Cottle County | 0 | 1 | 0 | 0 | 0 | 0 | 70.03 | 0 | 0 | 0 |
| Crane County | 0 | 2 | 1 | 0 | 1 | 0 | 40.77 | 19.97 | 0 | 21.1 |
| Crockett County | 3 | 2 | 1 | 0 | 2 | 79.77 | 52.83 | 26.8 | 0 | 56.12 |
| Crosby County | 0 | 1 | 1 | 0 | 1 | 0 | 17.17 | 16.9 | 0 | 16.95 |
| Culberson County | 1 | 3 | 2 | 1 | 0 | 43.38 | 131.58 | 88.85 | 45.07 | 0 |
| Dallam County | 0 | 2 | 1 | 0 | 0 | 0 | 27.77 | 13.77 | 0 | 0 |
| Dallas County | 98 | 98 | 103 | 131 | 114 | 3.95 | 3.89 | 4.03 | 5.06 | 4.35 |
| Dawson County | 2 | 2 | 1 | 1 | 1 | 15.15 | 14.89 | 7.7 | 7.67 | 7.8 |
| Deaf Smith County | 1 | 1 | 0 | 1 | 0 | 5.22 | 5.24 | 0 | 5.31 | 0 |
| Delta County | 2 | 0 | 0 | 3 | 0 | 39.08 | 0 | 0 | 58.3 | 0 |
| Denton County | 17 | 14 | 12 | 18 | 21 | 2.33 | 1.86 | 1.54 | 2.23 | 2.51 |
| Dewitt County | 0 | 2 | 1 | 2 | 1 | 0 | 9.75 | 4.85 | 9.7 | 4.94 |
| Dickens County | 0 | 0 | 0 | 0 | 1 | 0 | 0 | 0 | 0 | 45.27 |
| Dimmit County | 4 | 3 | 2 | 0 | 0 | 36.68 | 27.22 | 18.21 | 0 | 0 |
| Donley County | 0 | 1 | 0 | 0 | 0 | 0 | 28.56 | 0 | 0 | 0 |
| Duval County | 1 | 0 | 1 | 1 | 2 | 8.63 | 0 | 8.82 | 8.73 | 17.74 |
| Eastland County | 3 | 4 | 2 | 0 | 2 | 16.41 | 21.93 | 11.01 | 0 | 10.86 |
| Ector County | 26 | 16 | 22 | 14 | 25 | 17.37 | 10.35 | 13.76 | 8.88 | 15.91 |
| Edwards County | 0 | 0 | 2 | 0 | 0 | 0 | 0 | 104.71 | 0 | 0 |
| El Paso County | 30 | 31 | 33 | 39 | 22 | 3.61 | 3.72 | 3.96 | 4.66 | 2.62 |
| Ellis County | 7 | 11 | 11 | 7 | 10 | 4.49 | 6.91 | 6.74 | 4.16 | 5.76 |
| Erath County | 1 | 4 | 4 | 6 | 2 | 2.51 | 9.87 | 9.7 | 14.48 | 4.77 |
| Falls County | 1 | 4 | 1 | 1 | 0 | 5.8 | 23.25 | 5.8 | 5.77 | 0 |
| Fannin County | 1 | 2 | 2 | 4 | 8 | 2.98 | 5.95 | 5.97 | 11.82 | 23.22 |
| Fayette County | 6 | 3 | 5 | 2 | 6 | 24.28 | 12.1 | 20.03 | 7.98 | 23.74 |
| Fisher County | 0 | 4 | 0 | 1 | 1 | 0 | 103.28 | 0 | 25.77 | 25.77 |
| Floyd County | 1 | 1 | 0 | 1 | 0 | 16.02 | 16.82 | 0 | 17.02 | 0 |
| Foard County | 1 | 0 | 0 | 0 | 0 | 77.64 | 0 | 0 | 0 | 0 |
| Fort Bend County | 23 | 14 | 15 | 17 | 14 | 3.52 | 2.05 | 2.1 | 2.29 | 1.83 |
| Franklin County | 1 | 2 | 2 | 2 | 0 | 9.42 | 18.93 | 18.88 | 18.76 | 0 |
| Freestone County | 2 | 2 | 2 | 9 | 2 | 10.21 | 10.18 | 10.15 | 45.81 | 10.19 |
| Frio County | 3 | 0 | 5 | 1 | 0 | 16.32 | 0 | 25.96 | 5.16 | 0 |
| Gaines County | 5 | 2 | 3 | 3 | 1 | 26.61 | 10.35 | 14.84 | 14.65 | 4.85 |
| Galveston County | 12 | 22 | 16 | 19 | 18 | 3.91 | 7.02 | 4.98 | 5.77 | 5.37 |
| Garza County | 0 | 1 | 0 | 1 | 1 | 0 | 15.61 | 0 | 15.52 | 15.32 |
| Gillespie County | 1 | 2 | 2 | 2 | 4 | 3.95 | 7.85 | 7.7 | 7.6 | 15.01 |
| Glasscock County | 2 | 2 | 1 | 1 | 0 | 158.23 | 151.86 | 73.05 | 74.07 | 0 |
| Goliad County | 0 | 1 | 1 | 1 | 0 | 0 | 13.33 | 13.32 | 13.3 | 0 |
| Gonzales County | 3 | 4 | 6 | 3 | 2 | 14.9 | 19.65 | 29.21 | 14.38 | 9.57 |
| Gray County | 0 | 2 | 2 | 1 | 4 | 0 | 8.53 | 8.6 | 4.4 | 17.85 |
| Grayson County | 9 | 7 | 6 | 9 | 7 | 7.36 | 5.67 | 4.78 | 7.02 | 5.34 |
| Gregg County | 4 | 7 | 7 | 9 | 12 | 3.25 | 5.69 | 5.65 | 7.28 | 9.73 |
| Grimes County | 3 | 2 | 6 | 5 | 5 | 11.2 | 7.4 | 21.95 | 18.13 | 17.8 |
| Guadalupe County | 7 | 3 | 8 | 14 | 9 | 4.9 | 2.04 | 5.31 | 9.06 | 5.64 |
| Hale County | 1 | 3 | 2 | 1 | 2 | 2.8 | 8.7 | 5.87 | 2.92 | 5.86 |
| Hall County | 1 | 0 | 2 | 0 | 0 | 31.62 | 0 | 64.68 | 0 | 0 |
| Hamilton County | 0 | 1 | 1 | 0 | 2 | 0 | 12.27 | 12.39 | 0 | 23.75 |
| Hansford County | 2 | 1 | 1 | 0 | 0 | 36.13 | 18.07 | 17.83 | 0 | 0 |
| Hardeman County | 1 | 2 | 0 | 0 | 1 | 24.61 | 50.15 | 0 | 0 | 25.04 |
| Hardin County | 7 | 3 | 3 | 2 | 6 | 12.66 | 5.4 | 5.38 | 3.55 | 10.5 |
| Harris County | 174 | 210 | 170 | 209 | 202 | 4 | 4.72 | 3.74 | 4.53 | 4.34 |
| Harrison County | 12 | 4 | 8 | 5 | 8 | 18.11 | 6 | 11.98 | 7.49 | 12 |
| Hartley County | 0 | 1 | 1 | 1 | 1 | 0 | 16.56 | 17.62 | 17.53 | 17.57 |
| Haskell County | 1 | 2 | 2 | 0 | 4 | 16.93 | 34.49 | 34.38 | 0 | 69.61 |
| Hays County | 6 | 9 | 5 | 19 | 15 | 3.41 | 4.87 | 2.57 | 9.3 | 6.99 |
| Hemphill County | 0 | 1 | 1 | 0 | 0 | 0 | 23.95 | 23.3 | 0 | 0 |
| Henderson County | 4 | 5 | 6 | 4 | 8 | 5.09 | 6.31 | 7.55 | 5 | 9.87 |
| Hidalgo County | 25 | 26 | 30 | 38 | 25 | 3.06 | 3.14 | 3.57 | 4.47 | 2.9 |
| Hill County | 4 | 5 | 7 | 4 | 3 | 11.48 | 14.38 | 20.09 | 11.37 | 8.37 |
| Hockley County | 1 | 3 | 3 | 2 | 2 | 4.27 | 12.79 | 12.87 | 8.66 | 8.66 |
| Hood County | 2 | 3 | 2 | 7 | 4 | 3.78 | 5.57 | 3.61 | 12.33 | 6.86 |
| Hopkins County | 1 | 1 | 3 | 3 | 3 | 2.83 | 2.8 | 8.34 | 8.29 | 8.22 |
| Houston County | 5 | 2 | 3 | 3 | 5 | 21.92 | 8.77 | 13.19 | 13.11 | 21.72 |
| Howard County | 4 | 2 | 5 | 4 | 2 | 11.06 | 5.48 | 13.46 | 10.92 | 5.55 |
| Hudspeth County | 6 | 3 | 3 | 2 | 7 | 179.8 | 92.08 | 87.31 | 49.1 | 158.8 |
| Hunt County | 3 | 5 | 4 | 6 | 8 | 3.43 | 5.64 | 4.46 | 6.53 | 8.52 |
| Hutchinson County | 0 | 5 | 2 | 3 | 0 | 0 | 22.83 | 9.18 | 13.91 | 0 |
| Irion County | 1 | 5 | 1 | 0 | 0 | 62.07 | 317.66 | 64.81 | 0 | 0 |
| Jack County | 1 | 0 | 1 | 0 | 0 | 11.24 | 0 | 11.31 | 0 | 0 |
| Jackson County | 3 | 3 | 2 | 3 | 2 | 20.54 | 20.38 | 13.52 | 20.2 | 13.51 |
| Jasper County | 4 | 2 | 4 | 2 | 2 | 11.24 | 5.65 | 11.35 | 5.65 | 5.62 |
| Jeff Davis County | 0 | 1 | 0 | 0 | 0 | 0 | 45.05 | 0 | 0 | 0 |
| Jefferson County | 7 | 9 | 11 | 15 | 14 | 2.77 | 3.56 | 4.32 | 5.86 | 5.46 |
| Jim Hogg County | 0 | 3 | 1 | 1 | 0 | 0 | 56.39 | 18.93 | 19.07 | 0 |
| Jim Wells County | 4 | 5 | 7 | 1 | 3 | 9.6 | 12.06 | 16.88 | 2.43 | 7.34 |
| Johnson County | 7 | 9 | 14 | 8 | 9 | 4.53 | 5.74 | 8.78 | 4.91 | 5.38 |
| Jones County | 2 | 3 | 0 | 2 | 3 | 9.98 | 15.11 | 0 | 10 | 15.01 |
| Karnes County | 6 | 3 | 4 | 2 | 0 | 40.76 | 20.23 | 26.23 | 13.1 | 0 |
| Kaufman County | 5 | 9 | 5 | 13 | 9 | 4.62 | 8.11 | 4.38 | 11.01 | 7.32 |
| Kendall County | 4 | 3 | 3 | 2 | 1 | 10.76 | 7.81 | 7.51 | 4.77 | 2.27 |
| Kenedy County | 0 | 0 | 0 | 1 | 0 | 0 | 0 | 0 | 233.64 | 0 |
| Kent County | 0 | 1 | 0 | 0 | 1 | 0 | 133.69 | 0 | 0 | 131.06 |
| Kerr County | 3 | 5 | 3 | 4 | 1 | 6.03 | 9.95 | 5.91 | 7.8 | 1.93 |
| Kimble County | 1 | 0 | 3 | 4 | 2 | 22.4 | 0 | 68.31 | 90.33 | 45.35 |
| King County | 0 | 0 | 0 | 0 | 0 | 0 | 0 | 0 | 0 | 0 |
| Kinney County | 2 | 0 | 0 | 2 | 0 | 55.08 | 0 | 0 | 54.95 | 0 |
| Kleberg County | 2 | 3 | 1 | 3 | 2 | 6.25 | 9.42 | 3.18 | 9.57 | 6.43 |
| Knox County | 1 | 1 | 1 | 0 | 0 | 26.87 | 26.31 | 26.37 | 0 | 0 |
| La Salle County | 1 | 6 | 1 | 1 | 2 | 13.44 | 80.22 | 13.08 | 13.13 | 26.37 |
| Lamar County | 4 | 2 | 3 | 3 | 1 | 8.15 | 4.05 | 6.08 | 6.05 | 2.02 |
| Lamb County | 2 | 0 | 1 | 2 | 1 | 14.65 | 0 | 7.54 | 15.13 | 7.57 |
| Lampasas County | 1 | 0 | 0 | 2 | 1 | 4.97 | 0 | 0 | 9.68 | 4.76 |
| Lavaca County | 0 | 1 | 2 | 0 | 3 | 0 | 5.06 | 10.04 | 0 | 14.95 |
| Lee County | 5 | 4 | 4 | 3 | 2 | 30.2 | 24.05 | 23.69 | 17.65 | 11.64 |
| Leon County | 6 | 4 | 2 | 2 | 3 | 36.09 | 23.9 | 11.74 | 11.63 | 17.4 |
| Liberty County | 9 | 6 | 9 | 6 | 14 | 11.71 | 7.69 | 11.31 | 7.37 | 16.73 |
| Limestone County | 0 | 2 | 4 | 0 | 0 | 0 | 8.51 | 17.06 | 0 | 0 |
| Lipscomb County | 0 | 0 | 0 | 0 | 0 | 0 | 0 | 0 | 0 | 0 |
| Live Oak County | 5 | 3 | 2 | 2 | 4 | 42.32 | 24.91 | 16.45 | 16.64 | 32.86 |
| Llano County | 1 | 1 | 1 | 2 | 2 | 5.13 | 5.09 | 4.99 | 9.72 | 9.43 |
| Loving County | 0 | 0 | 1 | 1 | 0 | 0 | 0 | 840.34 | 869.57 | 0 |
| Lubbock County | 17 | 19 | 17 | 24 | 24 | 5.87 | 6.45 | 5.7 | 7.94 | 7.86 |
| Lynn County | 0 | 0 | 3 | 2 | 3 | 0 | 0 | 52.21 | 34.51 | 51.2 |
| Madison County | 2 | 3 | 2 | 4 | 2 | 14.49 | 21.67 | 14.35 | 28.38 | 14.06 |
| Marion County | 4 | 1 | 2 | 1 | 3 | 38.94 | 9.85 | 19.75 | 9.91 | 29.81 |
| Martin County | 0 | 1 | 6 | 2 | 0 | 0 | 18.27 | 105.71 | 35.16 | 0 |
| Mason County | 0 | 0 | 0 | 0 | 1 | 0 | 0 | 0 | 0 | 23.69 |
| Matagorda County | 4 | 2 | 7 | 4 | 4 | 10.96 | 5.48 | 19.04 | 10.78 | 10.86 |
| Maverick County | 1 | 2 | 3 | 5 | 3 | 1.77 | 3.51 | 5.2 | 8.62 | 5.15 |
| Mcculloch County | 0 | 3 | 1 | 1 | 0 | 0 | 36.8 | 12.12 | 12.31 | 0 |
| Mclennan County | 10 | 15 | 14 | 11 | 17 | 4.14 | 6.17 | 5.71 | 4.44 | 6.77 |
| Mcmullen County | 0 | 3 | 2 | 0 | 0 | 0 | 377.36 | 241.25 | 0 | 0 |
| Medina County | 2 | 1 | 5 | 5 | 4 | 4.23 | 2.09 | 10.33 | 10.16 | 7.99 |
| Menard County | 0 | 0 | 0 | 0 | 0 | 0 | 0 | 0 | 0 | 0 |
| Midland County | 18 | 21 | 17 | 12 | 23 | 11.82 | 13.41 | 10.49 | 7.34 | 13.94 |
| Milam County | 2 | 4 | 2 | 1 | 10 | 8.3 | 16.57 | 8.2 | 4.04 | 39.92 |
| Mills County | 0 | 1 | 1 | 0 | 0 | 0 | 20.55 | 20.46 | 0 | 0 |
| Mitchell County | 0 | 2 | 3 | 0 | 1 | 0 | 22.06 | 33.88 | 0 | 11.81 |
| Montague County | 1 | 3 | 2 | 2 | 2 | 5.16 | 15.48 | 10.37 | 10.29 | 10.24 |
| Montgomery County | 21 | 24 | 20 | 28 | 24 | 4.21 | 4.64 | 3.74 | 5.05 | 4.2 |
| Moore County | 9 | 4 | 3 | 1 | 3 | 40.64 | 18.16 | 13.71 | 4.56 | 13.58 |
| Morris County | 0 | 0 | 1 | 1 | 1 | 0 | 0 | 8.07 | 8.01 | 8.02 |
| Motley County | 1 | 0 | 0 | 0 | 0 | 83.89 | 0 | 0 | 0 | 0 |
| Nacogdoches County | 5 | 3 | 2 | 7 | 4 | 7.67 | 4.6 | 3.06 | 10.66 | 6.1 |
| Navarro County | 4 | 6 | 4 | 0 | 6 | 8.33 | 12.52 | 8.3 | 0 | 12.32 |
| Newton County | 0 | 2 | 3 | 1 | 1 | 0 | 13.99 | 21.17 | 7.05 | 7.17 |
| Nolan County | 1 | 2 | 2 | 4 | 3 | 6.64 | 13.23 | 13.3 | 26.72 | 20.31 |
| Nueces County | 14 | 17 | 18 | 16 | 22 | 3.97 | 4.77 | 4.99 | 4.43 | 6.09 |
| Ochiltree County | 2 | 3 | 0 | 0 | 0 | 18.75 | 28.08 | 0 | 0 | 0 |
| Oldham County | 1 | 5 | 0 | 0 | 1 | 47.87 | 241.55 | 0 | 0 | 47.3 |
| Orange County | 4 | 9 | 7 | 9 | 11 | 4.83 | 10.81 | 8.34 | 10.65 | 12.93 |
| Palo Pinto County | 4 | 2 | 2 | 3 | 2 | 14.35 | 7.14 | 7.15 | 10.66 | 7 |
| Panola County | 2 | 2 | 3 | 0 | 0 | 8.41 | 8.42 | 12.68 | 0 | 0 |
| Parker County | 4 | 5 | 10 | 6 | 5 | 3.34 | 4.09 | 7.96 | 4.66 | 3.75 |
| Parmer County | 0 | 1 | 1 | 0 | 1 | 0 | 10.07 | 10.2 | 0 | 10.16 |
| Pecos County | 2 | 3 | 4 | 2 | 6 | 12.77 | 18.94 | 24.97 | 12.6 | 38.38 |
| Polk County | 5 | 3 | 5 | 3 | 4 | 10.98 | 6.55 | 10.73 | 6.28 | 8.14 |
| Potter County | 13 | 12 | 8 | 12 | 12 | 10.65 | 9.84 | 6.6 | 9.96 | 9.96 |
| Presidio County | 0 | 0 | 0 | 0 | 1 | 0 | 0 | 0 | 0 | 13.97 |
| Rains County | 1 | 0 | 0 | 2 | 0 | 9.07 | 0 | 0 | 17.69 | 0 |
| Randall County | 8 | 6 | 7 | 6 | 2 | 6.31 | 4.66 | 5.37 | 4.53 | 1.49 |
| Reagan County | 1 | 2 | 3 | 0 | 1 | 27.55 | 52.8 | 78.76 | 0 | 26.95 |
| Real County | 2 | 2 | 2 | 2 | 1 | 60.26 | 59.74 | 60.66 | 58.88 | 29.16 |
| Red River County | 2 | 1 | 2 | 1 | 2 | 16.01 | 8.03 | 16.18 | 8.19 | 16.35 |
| Reeves County | 6 | 3 | 7 | 3 | 4 | 42.29 | 20.68 | 46.96 | 19.91 | 26.18 |
| Refugio County | 1 | 5 | 1 | 1 | 2 | 13.75 | 67.99 | 13.66 | 13.71 | 27.69 |
| Roberts County | 0 | 1 | 0 | 0 | 4 | 0 | 109.41 | 0 | 0 | 426.44 |
| Robertson County | 2 | 0 | 1 | 2 | 2 | 12.18 | 0 | 5.99 | 11.86 | 11.63 |
| Rockwall County | 2 | 1 | 3 | 4 | 6 | 2.36 | 1.15 | 3.33 | 4.28 | 6.2 |
| Runnels County | 1 | 3 | 1 | 3 | 0 | 9.82 | 29.22 | 9.66 | 29.25 | 0 |
| Rusk County | 7 | 6 | 7 | 5 | 4 | 13.12 | 11.28 | 13.23 | 9.46 | 7.57 |
| Sabine County | 2 | 4 | 1 | 1 | 1 | 19.19 | 38.36 | 9.57 | 9.63 | 9.56 |
| San Augustine County | 2 | 0 | 3 | 2 | 6 | 23.08 | 0 | 35.97 | 24.15 | 72.7 |
| San Jacinto County | 2 | 3 | 3 | 5 | 3 | 7.48 | 11.09 | 10.96 | 18.01 | 10.61 |
| San Patricio County | 4 | 6 | 3 | 1 | 6 | 6.05 | 9 | 4.47 | 1.49 | 8.93 |
| San Saba County | 1 | 1 | 0 | 1 | 0 | 17.57 | 17.19 | 0 | 17.03 | 0 |
| Schleicher County | 3 | 0 | 0 | 0 | 0 | 94.07 | 0 | 0 | 0 | 0 |
| Scurry County | 1 | 2 | 2 | 0 | 0 | 5.79 | 11.49 | 11.37 | 0 | 0 |
| Shackelford County | 0 | 1 | 0 | 1 | 0 | 0 | 30.08 | 0 | 29.73 | 0 |
| Shelby County | 2 | 3 | 3 | 4 | 3 | 7.7 | 11.69 | 11.76 | 15.52 | 11.76 |
| Sherman County | 0 | 1 | 0 | 0 | 0 | 0 | 32.59 | 0 | 0 | 0 |
| Smith County | 10 | 17 | 24 | 17 | 17 | 4.62 | 7.74 | 10.79 | 7.55 | 7.47 |
| Somervell County | 1 | 2 | 0 | 0 | 3 | 11.68 | 23.38 | 0 | 0 | 33.92 |
| Starr County | 3 | 3 | 1 | 3 | 2 | 4.82 | 4.77 | 1.57 | 4.69 | 3.1 |
| Stephens County | 0 | 0 | 0 | 0 | 0 | 0 | 0 | 0 | 0 | 0 |
| Sterling County | 0 | 0 | 0 | 0 | 0 | 0 | 0 | 0 | 0 | 0 |
| Stonewall County | 2 | 1 | 0 | 0 | 0 | 141.04 | 72.1 | 0 | 0 | 0 |
| Sutton County | 3 | 1 | 1 | 1 | 0 | 75.36 | 25.26 | 25.67 | 25.87 | 0 |
| Swisher County | 1 | 0 | 1 | 0 | 0 | 12.96 | 0 | 13.37 | 0 | 0 |
| Tarrant County | 63 | 71 | 66 | 69 | 84 | 3.29 | 3.65 | 3.33 | 3.41 | 4.09 |
| Taylor County | 3 | 6 | 8 | 6 | 4 | 2.24 | 4.45 | 5.89 | 4.41 | 2.93 |
| Terrell County | 0 | 0 | 0 | 1 | 0 | 0 | 0 | 0 | 122.25 | 0 |
| Terry County | 0 | 2 | 1 | 1 | 1 | 0 | 15.65 | 7.84 | 7.8 | 7.86 |
| Throckmorton County | 0 | 0 | 0 | 0 | 0 | 0 | 0 | 0 | 0 | 0 |
| Titus County | 1 | 2 | 4 | 2 | 2 | 3.07 | 6.16 | 12.22 | 6.13 | 6.08 |
| Tom Green County | 9 | 8 | 7 | 2 | 5 | 7.85 | 6.87 | 5.95 | 1.7 | 4.24 |
| Travis County | 54 | 50 | 71 | 44 | 57 | 4.81 | 4.34 | 6.03 | 3.65 | 4.65 |
| Trinity County | 2 | 1 | 2 | 6 | 1 | 13.85 | 7 | 13.79 | 41.34 | 6.82 |
| Tyler County | 2 | 3 | 3 | 1 | 1 | 9.3 | 13.99 | 14.04 | 4.67 | 4.64 |
| Upshur County | 1 | 3 | 4 | 7 | 1 | 2.52 | 7.45 | 9.91 | 17.13 | 2.42 |
| Upton County | 0 | 4 | 2 | 0 | 0 | 0 | 114.98 | 54.79 | 0 | 0 |
| Uvalde County | 5 | 3 | 0 | 1 | 1 | 18.62 | 11.09 | 0 | 3.69 | 3.69 |
| Val Verde County | 3 | 2 | 3 | 1 | 0 | 6.12 | 4.1 | 6.13 | 2.04 | 0 |
| Van Zandt County | 9 | 3 | 4 | 7 | 5 | 17.2 | 5.69 | 7.49 | 12.87 | 9.06 |
| Victoria County | 5 | 8 | 7 | 5 | 7 | 5.55 | 8.79 | 7.6 | 5.41 | 7.6 |
| Walker County | 7 | 11 | 3 | 12 | 11 | 10.08 | 15.71 | 4.24 | 16.74 | 15.23 |
| Waller County | 7 | 4 | 2 | 3 | 9 | 15.41 | 8.55 | 4.11 | 5.99 | 17.54 |
| Ward County | 3 | 7 | 6 | 1 | 3 | 26.76 | 60.46 | 51.55 | 8.63 | 26.15 |
| Washington County | 1 | 6 | 6 | 3 | 4 | 2.92 | 17.44 | 17.21 | 8.62 | 11.41 |
| Webb County | 8 | 6 | 5 | 15 | 8 | 3.03 | 2.25 | 1.85 | 5.51 | 2.91 |
| Wharton County | 5 | 5 | 7 | 4 | 2 | 12.17 | 12.17 | 16.92 | 9.61 | 4.77 |
| Wheeler County | 0 | 5 | 0 | 0 | 1 | 0 | 87.69 | 0 | 0 | 18.66 |
| Wichita County | 7 | 5 | 6 | 9 | 5 | 5.3 | 3.77 | 4.58 | 6.85 | 3.79 |
| Wilbarger County | 1 | 2 | 3 | 3 | 2 | 7.58 | 15.42 | 22.99 | 23.27 | 15.67 |
| Willacy County | 2 | 0 | 1 | 4 | 4 | 9.08 | 0 | 4.57 | 18.38 | 18.53 |
| Williamson County | 11 | 20 | 19 | 17 | 18 | 2.34 | 4.1 | 3.74 | 3.22 | 3.29 |
| Wilson County | 3 | 7 | 1 | 2 | 1 | 6.63 | 15.17 | 2.12 | 4.15 | 2.03 |
| Winkler County | 3 | 2 | 2 | 1 | 1 | 39.31 | 25.59 | 25.02 | 12.7 | 13.2 |
| Wise County | 2 | 4 | 5 | 11 | 6 | 3.28 | 6.48 | 7.95 | 17.06 | 9.07 |
| Wood County | 3 | 5 | 3 | 1 | 4 | 7.08 | 11.68 | 6.94 | 2.28 | 9.03 |
| Yoakum County | 0 | 2 | 0 | 0 | 0 | 0 | 23.86 | 0 | 0 | 0 |
| Young County | 0 | 1 | 1 | 1 | 0 | 0 | 5.47 | 5.51 | 5.53 | 0 |
| Zapata County | 1 | 0 | 1 | 1 | 0 | 6.95 | 0 | 6.89 | 6.92 | 0 |
| Zavala County | 0 | 2 | 3 | 3 | 2 | 0 | 16.35 | 24.4 | 24.81 | 16.74 |
Teen Drinking and Driving
In 26 states and D.C., under-21 alcohol-impaired driving fatalities per 100,000 population were at or below the national average of 1.2 deaths per 100,000 population.
The average teenage alcohol-impaired traffic fatality rate per 100,000 population for Texas was 1.9.
Texas has one of the highest teenage drinking and driving fatality rates in the U.S. But let’s look a little closer at the teenage drinking and driving arrest rates in Texas.
| DUI Arrest (Under 18 years old) | DUI Arrests (Under 18 years old) Total Per Million People | Rank |
|---|---|---|
| 421 | 57.71 | 34 |
Texas is ranked 34th in the U.S. for under-18 drinking and driving arrests.
EMS Response Time
Like we mentioned above, usually, more fatal crashes tend to happen in rural areas than in urban areas because there aren’t as many EMS stations located around the crash sites out in the country. However, Texas is flip-flopped.
| Area | Time of Crash to EMS Notification | EMS Notification to EMS Arrival | EMS Arrival at Scene to Hospital Arrival | Time of Crash to Hospital Arrival | Total Fatal Crashes |
|---|---|---|---|---|---|
| Rural | 7.68 mins | 15.91 mins | 44.07 mins | 63.89 mins | 1,281 |
| Urban | 4.31 mins | 8.18 mins | 27.01 mins | 38.38 mins | 2,052 |
In 2017, there were almost 800 more fatal crashes that happened in the city than in the country.
This leads us to the next section: transportation.
Transportation
What do transportation rates have to do with car insurance? Car insurance companies often base their rates off of averages.
Let’s dig a little deeper so we can show you what we mean.
Car Ownership
How many cars does the average Texan own?
According to Data USA, the following chart displays the households in Texas distributed between a series of car ownership buckets compared to the national averages for each bucket. The largest share of households in Texas have two cars, followed by three cars.
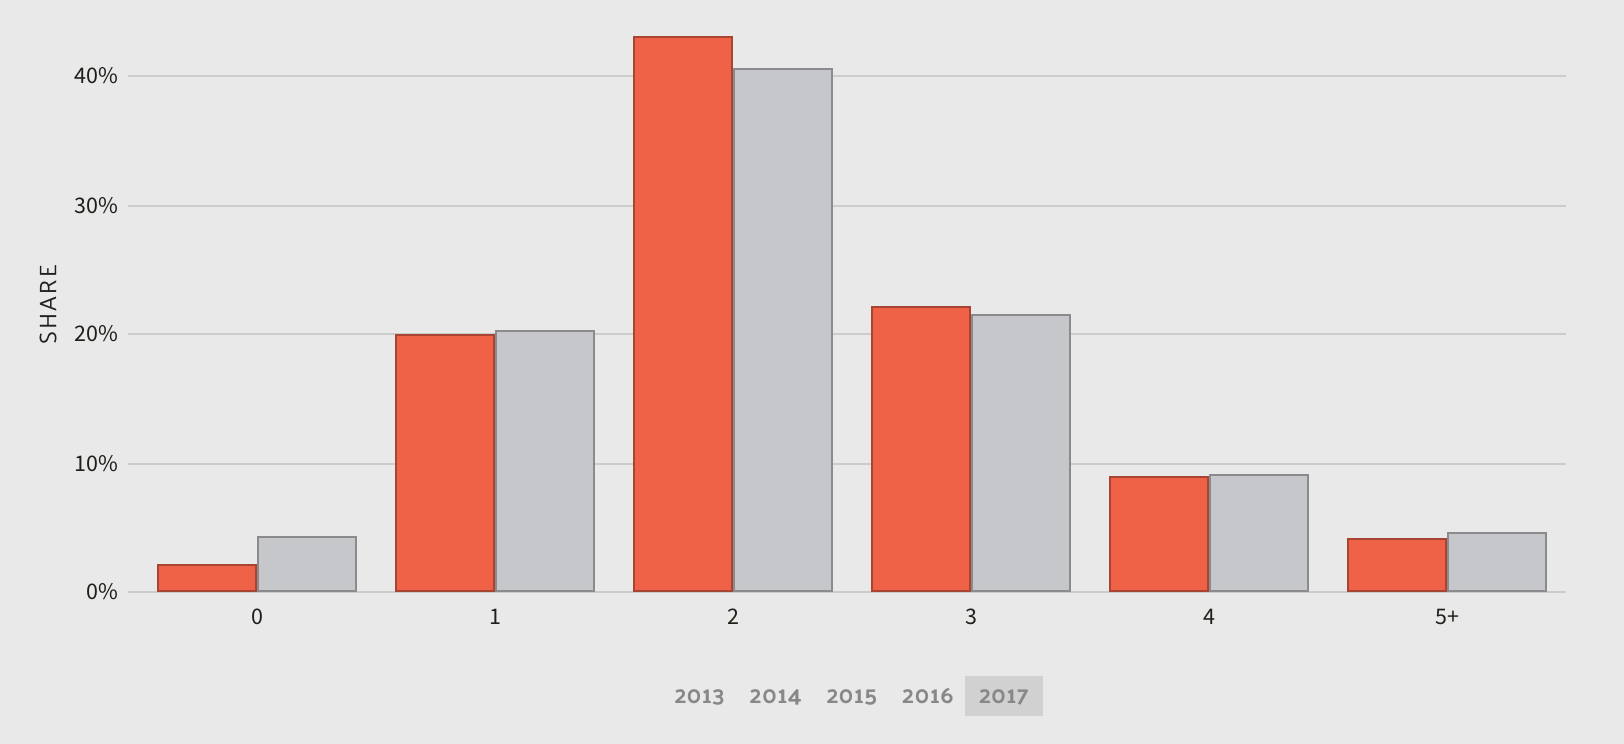
The orange bars represent Texas’s average while the gray bars represent America’s average.
Commute Time
Using averages, employees in Texas have a shorter commute time (25.2 minutes) than the normal US worker (25.5 minutes). Additionally, 2.23 percent of the workforce in Texas have “super commutes” in excess of 90 minutes.
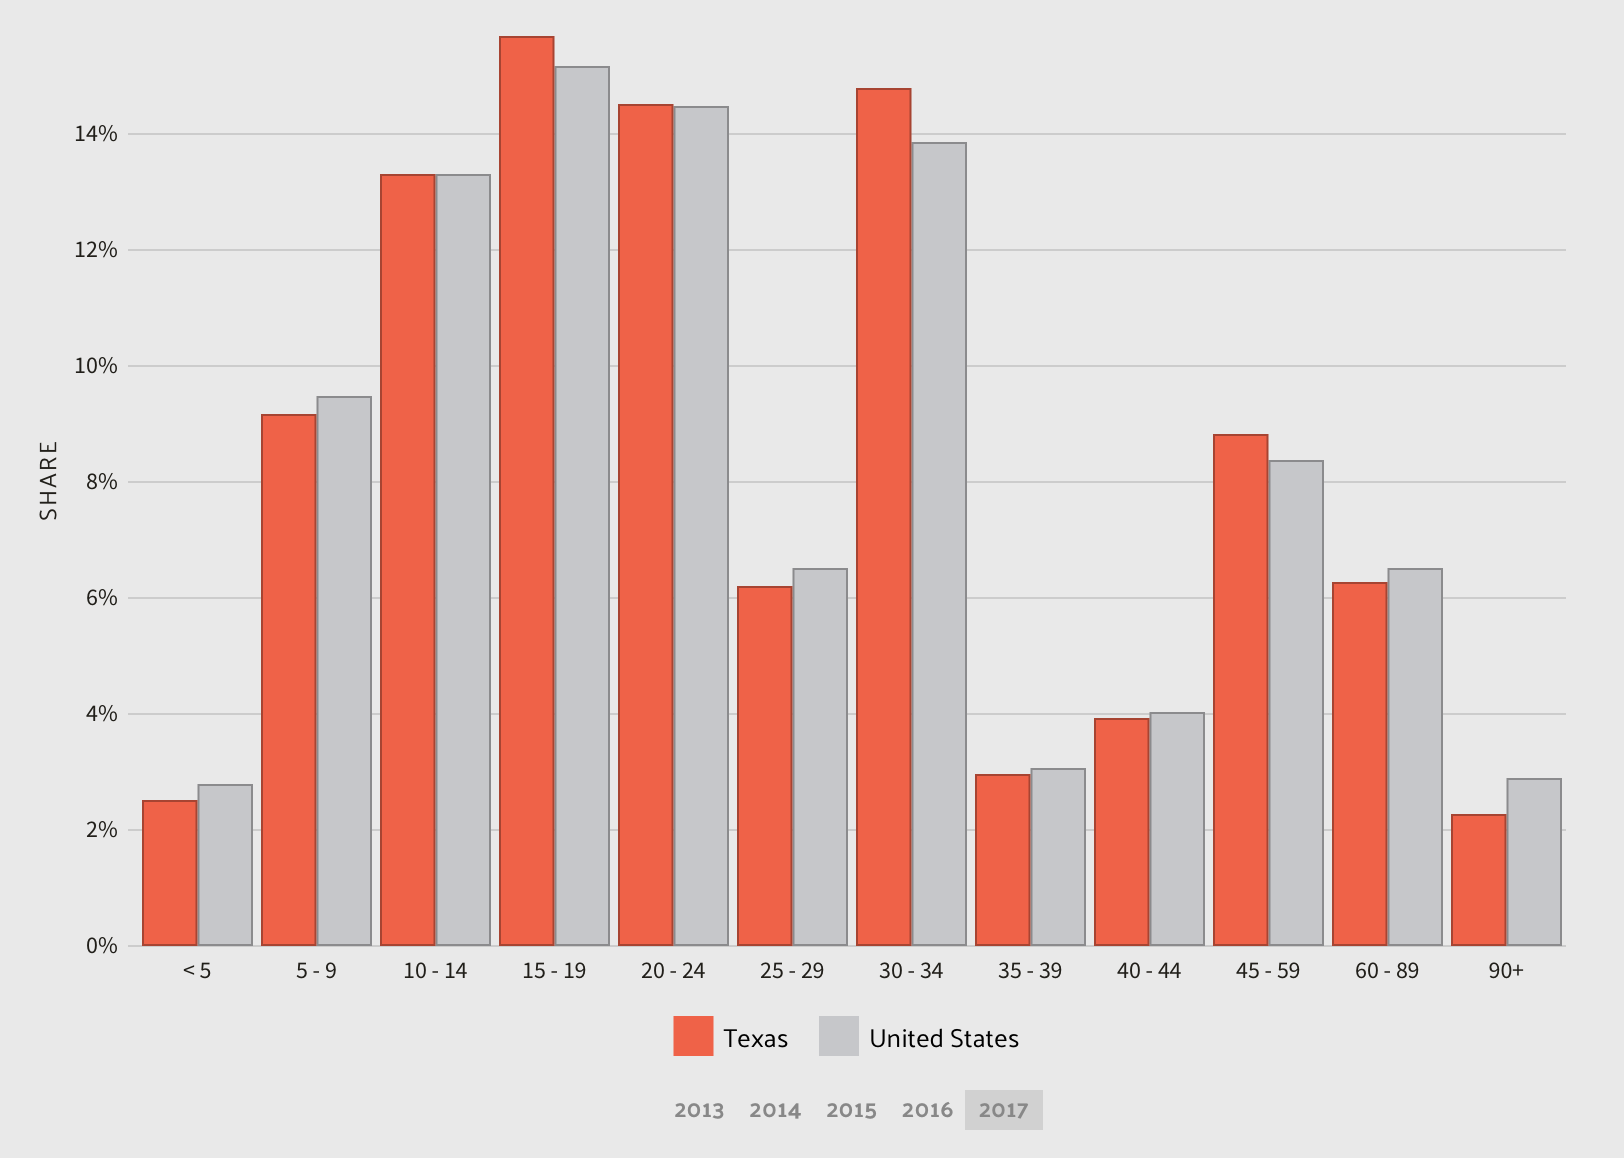
Commuter Transportation
In 2017, the most common method of travel for workers in Texas was to drive alone, followed by those who carpooled.
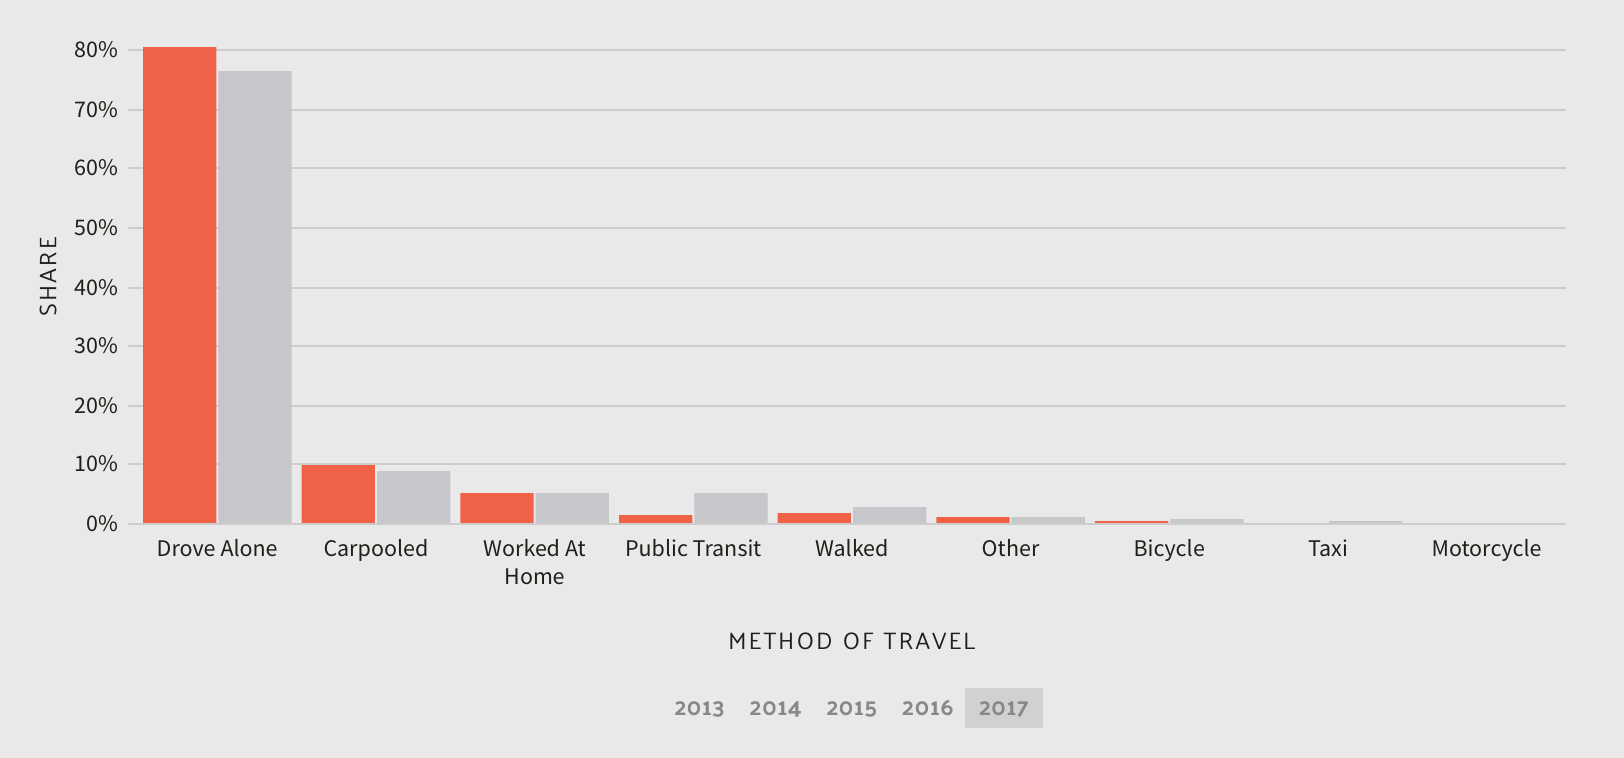
Traffic Congestion in Texas
According to Inrix, Houston, Texas is the 77th most traffic-congested city in the world.
| City | 2018 World Rank | Hours Lost in Congestion | Cost of Congestion (Per Driver) |
|---|---|---|---|
| Austin, TX | 84 | 104 | $1,452 |
| Corpus Christi, TX | 185 | 66 | $928 |
| Dallas, TX | 122 | 76 | $1,065 |
| El Paso, TX | 162 | 66 | $916 |
| Houston, TX | 77 | 98 | $1,365 |
| San Antonio, TX | 163 | 60 | $832 |
Now that we’ve covered all you need to know about Texas car insurance, it’s time to start shopping for your own unique rate. All you have to do is enter your zip code here in the box below.
Happy shopping.