Cheap Auto Insurance in Virginia (2024)
Free Auto Insurance Comparison
Enter your ZIP code below to compare auto insurance rates.
Secured with SHA-256 Encryption
Tracey L. Wells
Licensed Insurance Agent & Agency Owner
Tracey L. Wells is a licensed insurance agent and Farmers insurance agency owner with 23 years of experience. He is proud to be a local Farmers agent serving Grayson, Georgia and surrounding areas. With experience as both an underwriter and agent, he provides his customers with insight that others agents may not have. His agency offers all lines of insurance including home, life, auto, RV, busi...
Licensed Insurance Agent & Agency Owner
UPDATED: Aug 2, 2024
It’s all about you. We want to help you make the right coverage choices.
Advertiser Disclosure: We strive to help you make confident insurance decisions. Comparison shopping should be easy. We partner with top insurance providers. This doesn’t influence our content. Our opinions are our own.
Editorial Guidelines: We are a free online resource for anyone interested in learning more about auto insurance. Our goal is to be an objective, third-party resource for everything auto insurance related. We update our site regularly, and all content is reviewed by auto insurance experts.

Virginia Stats Summary | Details |
---|---|
Road Miles | Total in State: 75,061 Vehicle Miles Driven: 82,625 million |
Vehicles | Registered: 7,046,065 Total Stolen: 8,111 |
State Population | 8,366,767 |
Most Popular Vehicle in State | Honda CR-V |
Percent of Uninsured Motorists | 9.90% State Rank: 34 |
Total Driving Fatalities | Speeding Fatalities: 219 Drunk Driving Fatalities: 246 |
Average Annual Premiums | Liability: $425.61 Collision: $280.52 Comprehensive: $136.54 |
Cheapest Providers | Geico and USAA |
Auto insurance isn’t the most interesting topic in this world and we know that you would prefer to rely on your agent to explain all the details of your policy.
While that may seem easy, you could lose out on a lot of important information and may not even get the right coverage.
Like every other product or solution, auto insurance requirements are different for everyone and so is the policy coverage. Do not let your agent push a “one-size-fits-all” policy to you.
So, what should you do?
Before buying a policy, you should conduct in-depth research on what’s the right coverage for you and which company you should buy from.
To make it easy for you, we are writing a comprehensive car insurance guide to cover every important detail that you may need to drive stressfree in Virginia.
Searching for Virginia automobile insurance? Sometimes shopping for a provider can be complex. But with AutoInsuranceEZ.com, it’s as straightforward as keying in your zip code. We can supply you with the top 10 insurance providers in your spot, whether you live in a big city like Virginia Beach, Norfolk, or Chesapeake, or a lesser populated area such as Richmond or Newport News.
You can also start comparison shopping now using our FREE online tool. Enter your zip code above to get started.
Car Insurance Coverage and Rates in Virginia
During our daily chores, we hardly get time to check the average car insurance rates in our zip code or the types of coverage we should buy or the minimum coverage requirement in our state.
We would begin the guide by talking about how much coverage you’re required to buy and what rates you might have to pay based on the averages.
And, you will also understand what factors influence your rates and how rates vary depending on these factors.
Virginia’s Car Culture
Most of the residents of Virginia commute to D.C. for work which means frequent traffic jams and longer commutes. Because of that, the average commute time in Virginia is the seventh highest in America.
Add to that the state-wide preference for driving alone to work and you have a chaotic situation during peak hours.
In between all the stress of driving, Virginia does offer some picturesque vistas to enjoy on the road as it’s a beautiful state.
Minimum Car Insurance Requirement in Virginia
If you buy the minimum insurance coverage as mandated by the state laws, you wouldn’t be exposed to the financial risk in case you’re involved in an accident.
Unlike most of the states, you can drive in Virginia without car insurance coverage by paying an uninsured motor vehicle fee of $500 which has to be paid every time you renew your car’s registration.
Before you start to rejoice over that fact, let us remind you that the uninsured fee would only protect you from being prosecuted in the event of an accident, you would still have to bear the damages out-of-pocket.
If you think you’ll never get involved in an accident, you can take that option, but it would be a gamble.
Auto owners who want to protect themselves from any future losses arising out of collisions or rear-ending do have to at least maintain the minimum car insurance requirement.
Type of Coverage | Minimum Requirement |
---|---|
Bodily Injury Liability | $25,000 per person/$50,000 per accident |
Property Damage Liability | $20,000 |
The minimum coverage requirement for bodily injury liability pays for the cost of personal injury to the third-party (driver/passengers/pedestrians) if you’re the at-fault driver in an accident to the extent of $25,000 for one person and $50,000 overall.
The minimum property damage liability limit would cover any damages to the car/property of others up to $20,000.
Do note that liability insurance only covers third-party damages and any injury to you or your co-passengers isn’t covered.
That’s why auto owners are recommended to buy coverage that would protect their personal injuries and property damage.
What options for personal injury coverage do you have?
- Medical Payments: Med Pay covers your bodily injury expenses from an accident irrespective of the fault and takes quicker for disbursement than a health insurance policy. It also follows the policyholder, so whether you’re driving or just riding in a car, you would be covered.
- Personal Injury Protection (PIP): PIP also covers your medical expenses in an accident irrespective of fault, but it also reimburses you for lost wages until the time you’re unable to join back work because of injuries.
Both these are optional coverages and you can choose to have either for your medical expenses if you’re involved in an accident. We would recommend you to conduct a cost-benefit analysis and choose wisely from the two options.
Now, what happens if your car gets damaged because you have hit someone or something?
There are optional coverages that would pay for the expenses of property damage should you get involved in an accident or end up as a victim of a natural calamity.
- Collision Coverage: When you collide with something, such as a car, tree, or any other object, your collision coverage would pay for the cost of any damages to your car.
- Comprehensive Coverage: Your car might get damaged from situations outside your control, such as thunderstorms, fire, falling objects, vandalism or theft. Comprehensive insurance offers reimbursements for damages from these situations.
Apart from buying coverage to protect your personal damages, you should also think about buying the right amount of coverage for liability. Though the state mandates the minimum limits, it might not be enough to cover third-party expenses in a major accident.
Usually, you should aim to buy liability coverage of $500,000 (personal injury and property damage) at the minimum as medical expenses and legal costs can go through the roof.
Forms of Financial Responsibility in Virginia
If you want to drive legally in Virginia, you would have to meet the financial responsibility requirements of the state that ensures your ability to reimburse damages if you cause an accident.
- To meet this requirement, you have the option to buy the minimum liability insurance coverage with limits of 25/50/20
- You can also pay the uninsured motor vehicle fee of $500 but it doesn’t offer any insurance
- Business vehicles can meet this requirement through self-insurance or surety bonds.
Premiums as a Percentage of Income in Virginia
Budgeting for every cost might not be your strong suit, but you may want to take a look at the proportion of income auto owners in Virginia are spending on auto insurance premiums sourced from the National Association of Insurance Commissioners.
Details | 2012 | 2013 | 2014 |
---|---|---|---|
Disposable Income | $43,685 | $42,474 | $43,904 |
Average Annual Premiums | $781.38 | $809.40 | $836.14 |
Percentage of Income | 1.79% | 1.91% | 1.90% |
In 2014, the percentage of auto insurance premium to income was 1.90 percent which is much lower than the country-wide average.
Comparing the proportion of income spent on auto premiums with the neighboring states of Virginia, we can see that it’s better off than all of them.
You can also calculate what proportion of your income is being spent on auto premiums.
Core Coverage Auto Premiums in Virginia
Types of Coverage | Average Annual Premiums |
---|---|
Liability | $425.61 |
Collision | $280.52 |
Comprehensive | $136.54 |
Full Coverage | $842.67 |
On average, you can expect to pay $842 annually for full auto insurance coverage in Virginia.
Though premiums vary, sometimes drastically, depending on personal factors and policy limits, you can get an idea on how much you might have to pay for auto insurance.
Liability coverage is the basic that you must buy, if you choose to get insurance, for which the premium cost is only $425 compared to the national average of $538 per year.
Collision and comprehensive are optional coverages that you should buy if you want to protect your car from damages as a result of an accident.
Additional Liability Coverage in Virginia
Loss Ratio Table | 2015 | 2014 | 2013 |
---|---|---|---|
Medical Payments | 67.12% | 69.13% | 76.96% |
Uninsured/Underinsured Motorist Coverage | 74.89% | 72.95% | 69.58% |
Loss ratio signifies the ratio of claim settlements to premiums earned. If the loss ratio is 70 percent, it means an insurer has paid $70 in claims from total earned premiums of $100.
A very high loss ratio can mean that an insurer is making losses since an organization can’t survive if it’s paying out more in claims than its earning in premiums.
We have explained when you might need Medical Payments or PIP coverage, but you should also know about Uninsured/Underinsured Motorist Coverage (UM/UIM).
Not everyone buys car insurance, especially in Virginia where you can legally drive even if you aren’t insured, and you might get involved in an accident with a driver who isn’t adequately insured. Having UM/UIM coverage ensures that your damages would be reimbured by the insurer when you find yourself in such a situation.
As per data from the Insurance Information Institute, around 9.9 percent of the motorists in Virginia are uninsured which means that there’s some probability of an encounter with one of them.
If you want to get a quick overview of what the different types of auto insurance mean, you should watch this video.
https://www.youtube.com/watch?v=3JmQI06kkTw&t=67s
Add-ons, Endorsements, and Riders in Virginia
We hope that you understand what type of coverage you need by now. Insurance companies also offer some add-ons and riders to auto policies which motorists can buy as per their requirement.
Some of those are mentioned below, you can take a look and decide for yourself.
- Guaranteed Auto Protection (GAP)
- Personal Umbrella Policy (PUP)
- Rental Reimbursement
- Emergency Roadside Assistance
- Mechanical Breakdown Insurance
- Non-Owner Car Insurance
- Modified Car Insurance Coverage
- Classic Car Insurance
- Pay-As-You-Drive or Usage-Based Insurance
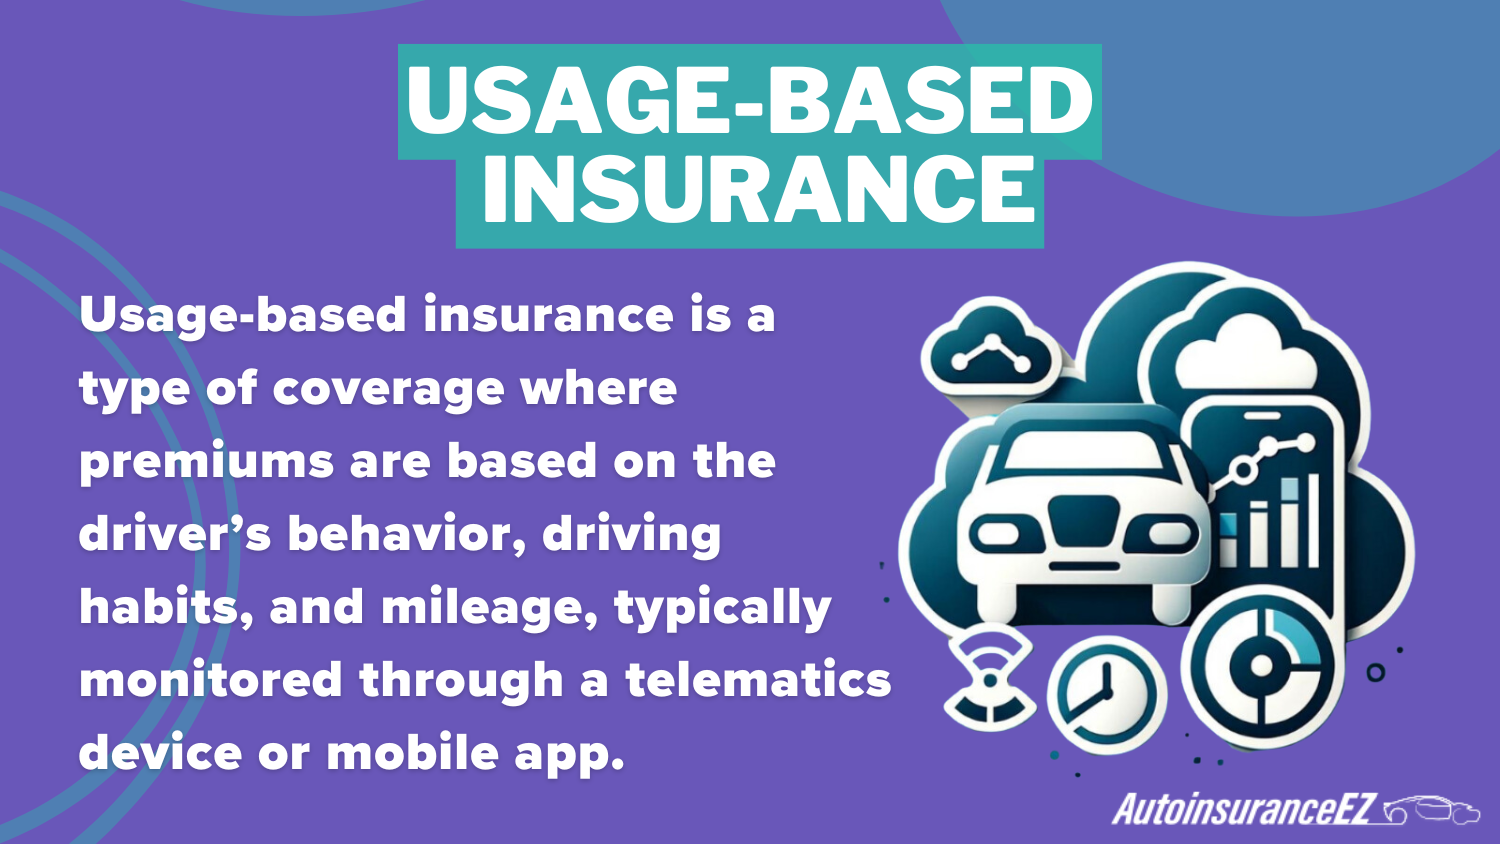
Pay-as-you-drive or usage-based insurance isn’t a type of coverage but a rewards program that can help you in getting discounts on auto premiums.
In a usage-based insurance program, you just have to install a telematics device in your car that would track your driving behavior, such as accelaration, braking, mileage, etc., to assess whether you’re a safe driver. Once you complete a specified time in the program, your discounts, if eligible, would be applied to your premiums.
Male vs Female Auto Insurance Premiums in Virginia
Insurance Providers | Single 17-year-old female | Single 17-year-old male | Single 25-year-old female | Single 25-year-old male | Married 35-year-old female | Married 35-year-old male | Married 60-year-old female | Married 60-year-old male |
---|---|---|---|---|---|---|---|---|
Allstate P&C | $6,396.46 | $7,347.87 | $2,657.43 | $2,658.75 | $2,042.71 | $1,927.39 | $2,031.96 | $2,031.96 |
Geico General | $3,138.15 | $4,204.21 | $1,714.05 | $1,694.63 | $1,474.02 | $1,470.60 | $1,398.20 | $1,398.20 |
Nationwide P&C | $3,416.59 | $4,404.98 | $1,582.01 | $1,722.41 | $1,434.40 | $1,443.10 | $1,272.72 | $1,307.89 |
Progressive Advanced | $5,745.36 | $6,458.02 | $1,518.75 | $1,551.92 | $1,253.97 | $1,191.17 | $1,132.78 | $1,136.43 |
State Farm Mutual Auto | $4,201.32 | $5,274.60 | $1,572.89 | $1,810.26 | $1,391.16 | $1,391.16 | $1,254.98 | $1,254.98 |
USAA | $3,443.74 | $4,098.09 | $1,436.42 | $1,578.62 | $1,116.18 | $1,099.39 | $1,043.95 | $1,050.74 |
Among the many factors that impact your car insurance rates, your gender is one of them. Especially when you’re younger, rates vary drastically for men and women.
Because younger men (usually below 25) are considered riskier drivers than females of their age. There have been studies that proved the claim.
In Virginia, almost all the insurers charge at least $1,000 extra from single 17-year-old males than their female counterparts. The premium rates between men and women are quite similar after they turn 25.
Once you get older, other factors take precedence for rate calculations rather than gender.
You can see how these carriers rank as per the demographics.
Insurance Providers | Demographic | Average Annual Rate | Rank |
---|---|---|---|
Allstate P&C | Single 17-year old male | $7,347.87 | 1 |
Progressive Advanced | Single 17-year old male | $6,458.02 | 2 |
Allstate P&C | Single 17-year old female | $6,396.46 | 3 |
Progressive Advanced | Single 17-year old female | $5,745.36 | 4 |
State Farm Mutual Auto | Single 17-year old male | $5,274.60 | 5 |
Nationwide P&C | Single 17-year old male | $4,404.98 | 6 |
Geico General | Single 17-year old male | $4,204.21 | 7 |
State Farm Mutual Auto | Single 17-year old female | $4,201.32 | 8 |
USAA | Single 17-year old male | $4,098.09 | 9 |
USAA | Single 17-year old female | $3,443.74 | 10 |
Nationwide P&C | Single 17-year old female | $3,416.59 | 11 |
Geico General | Single 17-year old female | $3,138.15 | 12 |
Allstate P&C | Single 25-year old male | $2,658.75 | 13 |
Allstate P&C | Single 25-year old female | $2,657.43 | 14 |
Allstate P&C | Married 35-year old female | $2,042.71 | 15 |
Allstate P&C | Married 60-year old female | $2,031.96 | 16 |
Allstate P&C | Married 60-year old male | $2,031.96 | 16 |
Allstate P&C | Married 35-year old male | $1,927.39 | 18 |
State Farm Mutual Auto | Single 25-year old male | $1,810.26 | 19 |
Nationwide P&C | Single 25-year old male | $1,722.41 | 20 |
Geico General | Single 25-year old female | $1,714.05 | 21 |
Geico General | Single 25-year old male | $1,694.63 | 22 |
Nationwide P&C | Single 25-year old female | $1,582.01 | 23 |
USAA | Single 25-year old male | $1,578.62 | 24 |
State Farm Mutual Auto | Single 25-year old female | $1,572.89 | 25 |
Progressive Advanced | Single 25-year old male | $1,551.92 | 26 |
Progressive Advanced | Single 25-year old female | $1,518.75 | 27 |
Geico General | Married 35-year old female | $1,474.02 | 28 |
Geico General | Married 35-year old male | $1,470.60 | 29 |
Nationwide P&C | Married 35-year old male | $1,443.10 | 30 |
USAA | Single 25-year old female | $1,436.42 | 31 |
Nationwide P&C | Married 35-year old female | $1,434.40 | 32 |
Geico General | Married 60-year old female | $1,398.20 | 33 |
Geico General | Married 60-year old male | $1,398.20 | 33 |
State Farm Mutual Auto | Married 35-year old female | $1,391.16 | 35 |
State Farm Mutual Auto | Married 35-year old male | $1,391.16 | 35 |
Nationwide P&C | Married 60-year old male | $1,307.89 | 37 |
Nationwide P&C | Married 60-year old female | $1,272.72 | 38 |
State Farm Mutual Auto | Married 60-year old female | $1,254.98 | 39 |
State Farm Mutual Auto | Married 60-year old male | $1,254.98 | 39 |
Progressive Advanced | Married 35-year old female | $1,253.97 | 41 |
Progressive Advanced | Married 35-year old male | $1,191.17 | 42 |
Progressive Advanced | Married 60-year old male | $1,136.43 | 43 |
Progressive Advanced | Married 60-year old female | $1,132.78 | 44 |
USAA | Married 35-year old female | $1,116.18 | 45 |
USAA | Married 35-year old male | $1,099.39 | 46 |
USAA | Married 60-year old male | $1,050.74 | 47 |
USAA | Married 60-year old female | $1,043.95 | 48 |
Auto Insurance Rates in the Largest Cities of Virginia
In case, you want to see the rates in the ten largest cities of Virginia by population, you can search for the cities in the table below.
Zipcode | Average Annual Premiums | Compared to Average (+/-) | City |
---|---|---|---|
23457 | $2,508.60 | $150.73 | VIRGINIA BEACH |
23462 | $2,498.53 | $140.66 | VIRGINIA BEACH |
23453 | $2,497.09 | $139.22 | VIRGINIA BEACH |
23461 | $2,493.73 | $135.86 | VIRGINIA BEACH |
23452 | $2,484.37 | $126.50 | VIRGINIA BEACH |
23460 | $2,483.55 | $125.68 | VIRGINIA BEACH |
23454 | $2,480.12 | $122.25 | VIRGINIA BEACH |
23451 | $2,474.70 | $116.83 | VIRGINIA BEACH |
23455 | $2,469.73 | $111.86 | VIRGINIA BEACH |
23459 | $2,465.77 | $107.90 | VIRGINIA BEACH |
23456 | $2,464.43 | $106.56 | VIRGINIA BEACH |
23464 | $2,462.47 | $104.60 | VIRGINIA BEACH |
23511 | $2,738.46 | $380.59 | NORFOLK |
23503 | $2,721.78 | $363.91 | NORFOLK |
23504 | $2,682.48 | $324.61 | NORFOLK |
23513 | $2,681.14 | $323.27 | NORFOLK |
23505 | $2,668.69 | $310.82 | NORFOLK |
23509 | $2,655.89 | $298.02 | NORFOLK |
23521 | $2,646.29 | $288.42 | NORFOLK |
23519 | $2,646.01 | $288.14 | NORFOLK |
23508 | $2,616.39 | $258.52 | NORFOLK |
23518 | $2,614.50 | $256.63 | NORFOLK |
23502 | $2,612.83 | $254.96 | NORFOLK |
23520 | $2,603.70 | $245.83 | NORFOLK |
23517 | $2,546.33 | $188.46 | NORFOLK |
23523 | $2,544.25 | $186.38 | NORFOLK |
23529 | $2,534.46 | $176.59 | NORFOLK |
23510 | $2,527.41 | $169.54 | NORFOLK |
23507 | $2,509.30 | $151.43 | NORFOLK |
23324 | $2,488.06 | $130.19 | CHESAPEAKE |
23322 | $2,460.97 | $103.10 | CHESAPEAKE |
23323 | $2,451.91 | $94.04 | CHESAPEAKE |
23320 | $2,418.40 | $60.53 | CHESAPEAKE |
23325 | $2,417.45 | $59.58 | CHESAPEAKE |
23321 | $2,416.54 | $58.67 | CHESAPEAKE |
23222 | $2,800.69 | $442.82 | RICHMOND |
23223 | $2,748.67 | $390.80 | RICHMOND |
23224 | $2,747.42 | $389.55 | RICHMOND |
23219 | $2,715.66 | $357.79 | RICHMOND |
23298 | $2,681.13 | $323.26 | RICHMOND |
23220 | $2,651.47 | $293.60 | RICHMOND |
23232 | $2,622.33 | $264.46 | RICHMOND |
23234 | $2,548.74 | $190.87 | RICHMOND |
23227 | $2,522.53 | $164.66 | RICHMOND |
23225 | $2,520.17 | $162.30 | RICHMOND |
23237 | $2,480.67 | $122.80 | RICHMOND |
23226 | $2,469.68 | $111.81 | RICHMOND |
23235 | $2,460.44 | $102.57 | RICHMOND |
23221 | $2,443.59 | $85.72 | RICHMOND |
23250 | $2,442.82 | $84.95 | RICHMOND |
23230 | $2,437.36 | $79.49 | RICHMOND |
23236 | $2,420.09 | $62.22 | RICHMOND |
22204 | $2,741.36 | $383.49 | ARLINGTON |
22214 | $2,690.79 | $332.92 | ARLINGTON |
22206 | $2,579.56 | $221.69 | ARLINGTON |
22207 | $2,559.44 | $201.57 | ARLINGTON |
22213 | $2,536.66 | $178.79 | ARLINGTON |
22205 | $2,501.30 | $143.43 | ARLINGTON |
22202 | $2,485.66 | $127.79 | ARLINGTON |
22203 | $2,451.37 | $93.50 | ARLINGTON |
22201 | $2,415.70 | $57.83 | ARLINGTON |
22209 | $2,414.85 | $56.98 | ARLINGTON |
23605 | $2,442.04 | $84.17 | NEWPORT NEWS |
23607 | $2,423.59 | $65.72 | NEWPORT NEWS |
23608 | $2,394.51 | $36.64 | NEWPORT NEWS |
23603 | $2,392.66 | $34.79 | NEWPORT NEWS |
23602 | $2,385.17 | $27.30 | NEWPORT NEWS |
23601 | $2,381.76 | $23.89 | NEWPORT NEWS |
23606 | $2,355.07 | ($2.80) | NEWPORT NEWS |
22312 | $2,871.02 | $513.15 | ALEXANDRIA |
22311 | $2,838.19 | $480.32 | ALEXANDRIA |
22309 | $2,806.21 | $448.34 | ALEXANDRIA |
22306 | $2,788.84 | $430.97 | ALEXANDRIA |
22304 | $2,762.26 | $404.39 | ALEXANDRIA |
22310 | $2,751.14 | $393.27 | ALEXANDRIA |
22303 | $2,730.54 | $372.67 | ALEXANDRIA |
22315 | $2,727.73 | $369.86 | ALEXANDRIA |
22308 | $2,695.92 | $338.05 | ALEXANDRIA |
22307 | $2,677.33 | $319.46 | ALEXANDRIA |
22302 | $2,660.55 | $302.68 | ALEXANDRIA |
22331 | $2,648.26 | $290.39 | ALEXANDRIA |
22332 | $2,648.26 | $290.39 | ALEXANDRIA |
22305 | $2,628.61 | $270.74 | ALEXANDRIA |
22301 | $2,612.14 | $254.27 | ALEXANDRIA |
22314 | $2,602.19 | $244.32 | ALEXANDRIA |
23668 | $2,507.90 | $150.03 | HAMPTON |
23664 | $2,493.51 | $135.64 | HAMPTON |
23661 | $2,489.51 | $131.64 | HAMPTON |
23663 | $2,475.69 | $117.82 | HAMPTON |
23666 | $2,471.04 | $113.17 | HAMPTON |
23669 | $2,454.57 | $96.70 | HAMPTON |
23665 | $2,391.08 | $33.21 | HAMPTON |
24018 | $2,214.12 | ($143.75) | ROANOKE |
24015 | $2,203.95 | ($153.92) | ROANOKE |
24016 | $2,193.59 | ($164.28) | ROANOKE |
24011 | $2,190.54 | ($167.33) | ROANOKE |
24017 | $2,187.58 | ($170.29) | ROANOKE |
24013 | $2,187.18 | ($170.69) | ROANOKE |
24012 | $2,171.21 | ($186.66) | ROANOKE |
24019 | $2,158.24 | ($199.63) | ROANOKE |
24014 | $2,128.82 | ($229.05) | ROANOKE |
23704 | $2,618.86 | $260.99 | PORTSMOUTH |
23702 | $2,597.42 | $239.55 | PORTSMOUTH |
23709 | $2,590.43 | $232.56 | PORTSMOUTH |
23708 | $2,584.89 | $227.02 | PORTSMOUTH |
23707 | $2,524.60 | $166.73 | PORTSMOUTH |
23701 | $2,509.75 | $151.88 | PORTSMOUTH |
23703 | $2,456.87 | $99.00 | PORTSMOUTH |
The state-wide average annual premium is $2,357. Except for Roanoke, the auto premium in all the other largest cities is higher than the average.
Amongst those cities, Alexandria, Richmond, and Norfolk have the highest rates, though some zip codes in the other cities do have pretty high rates.
Auto Insurance Rates by Zip Code in Virginia
If you don’t live in one of the most populated cities of Virginia, you can search for your zip code in the tables below which show auto premiums from most expensive to least expensive areas and also the rates offered by different insurance providers.
Cheapest ZIP Codes in Virginia | City | Average by ZIP Codes | Most Expensive Company | Most Expensive Rate | 2nd Most Expensive Company | 2nd Most Expensive Rate | Cheapest Company | Cheapest Rate | 2nd Cheapest Company | 2nd Cheapest Rate |
---|---|---|---|---|---|---|---|---|---|---|
24450 | LEXINGTON | $2,018.13 | Allstate | $3,002.04 | Progressive | $2,054.03 | USAA | $1,638.89 | Nationwide | $1,646.95 |
22802 | HARRISONBURG | $2,031.22 | Allstate | $3,017.99 | Progressive | $1,930.39 | USAA | $1,624.96 | State Farm | $1,805.27 |
24401 | STAUNTON | $2,033.51 | Allstate | $3,046.63 | Geico | $1,921.33 | USAA | $1,639.53 | Nationwide | $1,845.67 |
22815 | BROADWAY | $2,034.01 | Allstate | $3,017.99 | Progressive | $2,048.27 | USAA | $1,624.96 | State Farm | $1,704.15 |
24060 | BLACKSBURG | $2,035.11 | Allstate | $3,021.92 | Progressive | $2,161.26 | USAA | $1,568.22 | Geico | $1,665.52 |
22840 | MC GAHEYSVILLE | $2,036.30 | Allstate | $2,998.27 | Progressive | $1,964.11 | USAA | $1,624.96 | State Farm | $1,821.75 |
22834 | LINVILLE | $2,037.09 | Allstate | $3,017.99 | Progressive | $2,103.54 | USAA | $1,624.96 | State Farm | $1,667.35 |
22853 | TIMBERVILLE | $2,038.95 | Allstate | $3,017.99 | Progressive | $2,131.25 | USAA | $1,624.96 | State Farm | $1,650.81 |
24416 | BUENA VISTA | $2,039.40 | Allstate | $3,002.04 | Progressive | $2,080.60 | USAA | $1,638.89 | Nationwide | $1,646.95 |
22833 | LACEY SPRING | $2,041.03 | Allstate | $2,998.27 | Progressive | $2,007.60 | USAA | $1,624.96 | State Farm | $1,806.66 |
24073 | CHRISTIANSBURG | $2,042.79 | Allstate | $3,021.92 | State Farm | $2,045.19 | Geico | $1,665.52 | USAA | $1,681.92 |
22812 | BRIDGEWATER | $2,043.31 | Allstate | $3,046.63 | Progressive | $1,993.75 | USAA | $1,624.96 | State Farm | $1,785.82 |
22801 | HARRISONBURG | $2,044.17 | Allstate | $3,046.63 | Progressive | $1,953.86 | USAA | $1,624.96 | State Farm | $1,830.88 |
22939 | FISHERSVILLE | $2,044.69 | Allstate | $3,046.63 | Progressive | $2,027.19 | USAA | $1,623.59 | State Farm | $1,803.71 |
24471 | PORT REPUBLIC | $2,046.56 | Allstate | $3,046.63 | Progressive | $1,992.42 | USAA | $1,624.96 | State Farm | $1,806.66 |
22821 | DAYTON | $2,046.69 | Allstate | $3,046.63 | Progressive | $1,993.64 | USAA | $1,624.96 | State Farm | $1,806.25 |
22841 | MOUNT CRAWFORD | $2,048.17 | Allstate | $3,046.63 | Progressive | $1,957.50 | USAA | $1,624.96 | State Farm | $1,851.24 |
22830 | FULKS RUN | $2,048.95 | Allstate | $3,017.99 | Progressive | $2,081.09 | USAA | $1,624.96 | State Farm | $1,760.97 |
22848 | PLEASANT VALLEY | $2,049.22 | Allstate | $3,017.99 | Progressive | $2,037.02 | USAA | $1,624.96 | State Farm | $1,806.66 |
22803 | HARRISONBURG | $2,050.19 | Allstate | $3,017.99 | Progressive | $2,029.09 | USAA | $1,638.73 | State Farm | $1,806.66 |
24141 | RADFORD | $2,050.57 | Allstate | $3,071.64 | Progressive | $2,108.49 | Geico | $1,665.52 | USAA | $1,681.92 |
22811 | BERGTON | $2,050.97 | Allstate | $3,017.99 | Progressive | $2,086.55 | USAA | $1,624.96 | State Farm | $1,767.64 |
24435 | FAIRFIELD | $2,053.78 | Allstate | $3,002.04 | Progressive | $2,250.94 | USAA | $1,638.89 | Nationwide | $1,646.95 |
24486 | WEYERS CAVE | $2,055.76 | Allstate | $3,046.63 | Progressive | $2,023.71 | USAA | $1,639.53 | Nationwide | $1,845.67 |
22824 | EDINBURG | $2,056.80 | Allstate | $3,017.99 | Progressive | $1,984.59 | USAA | $1,629.62 | State Farm | $1,826.20 |
Zip code 24450 in Lexington has the cheapest car insurance rates.
Most Expensive ZIP Codes in Virginia | City | Average by ZIP Code | Most Expensive Company | Most Expensive Rate | 2nd Most Expensive Company | 2nd Most Expensive Rate | Cheapest Company | Cheapest Rate | 2nd Cheapest Company | 2nd Cheapest Rate |
---|---|---|---|---|---|---|---|---|---|---|
22312 | ALEXANDRIA | $2,871.02 | Allstate | $4,305.77 | Progressive | $2,992.08 | USAA | $2,205.48 | Geico | $2,352.28 |
22041 | FALLS CHURCH | $2,857.11 | Allstate | $4,305.77 | State Farm | $3,156.56 | Geico | $2,141.17 | USAA | $2,206.52 |
22151 | SPRINGFIELD | $2,855.79 | Allstate | $4,388.84 | Progressive | $2,953.33 | USAA | $2,169.90 | Geico | $2,352.28 |
22311 | ALEXANDRIA | $2,838.20 | Allstate | $4,184.46 | State Farm | $3,141.18 | Geico | $2,141.17 | USAA | $2,206.52 |
22003 | ANNANDALE | $2,834.25 | Allstate | $4,397.33 | Progressive | $2,945.54 | Geico | $2,141.17 | USAA | $2,178.61 |
22150 | SPRINGFIELD | $2,816.60 | Allstate | $4,305.77 | Progressive | $2,910.33 | USAA | $2,055.48 | Geico | $2,351.37 |
22309 | ALEXANDRIA | $2,806.21 | Allstate | $4,184.46 | State Farm | $2,940.41 | USAA | $2,251.53 | Geico | $2,351.37 |
23222 | RICHMOND | $2,800.69 | Allstate | $3,544.83 | State Farm | $3,154.85 | USAA | $2,137.93 | Nationwide | $2,628.11 |
22153 | SPRINGFIELD | $2,797.16 | Allstate | $4,231.92 | State Farm | $2,879.87 | USAA | $2,060.19 | Geico | $2,351.37 |
22060 | FORT BELVOIR | $2,794.01 | Allstate | $4,184.46 | State Farm | $2,917.93 | USAA | $2,057.33 | Geico | $2,351.37 |
22306 | ALEXANDRIA | $2,788.85 | Allstate | $4,184.46 | Progressive | $2,840.81 | USAA | $2,131.22 | Geico | $2,351.37 |
22079 | LORTON | $2,786.19 | Allstate | $4,348.02 | State Farm | $2,857.77 | USAA | $2,121.40 | Geico | $2,351.37 |
22044 | FALLS CHURCH | $2,777.26 | Allstate | $4,077.51 | State Farm | $2,967.14 | Geico | $2,141.17 | USAA | $2,208.46 |
22081 | MERRIFIELD | $2,776.35 | Allstate | $4,348.02 | Progressive | $2,975.48 | Geico | $2,017.21 | USAA | $2,121.40 |
22015 | BURKE | $2,773.79 | Allstate | $4,220.49 | Progressive | $2,890.07 | Geico | $2,141.17 | USAA | $2,159.44 |
22103 | WEST MCLEAN | $2,771.74 | Allstate | $4,110.52 | Progressive | $2,848.04 | USAA | $2,170.66 | Geico | $2,403.36 |
22304 | ALEXANDRIA | $2,762.26 | Allstate | $4,184.46 | State Farm | $2,835.49 | USAA | $2,155.94 | Geico | $2,352.28 |
22152 | SPRINGFIELD | $2,751.29 | Allstate | $4,220.49 | Progressive | $2,867.72 | Geico | $2,141.17 | USAA | $2,145.81 |
22310 | ALEXANDRIA | $2,751.15 | Allstate | $4,184.46 | Progressive | $2,860.28 | USAA | $2,083.13 | Geico | $2,175.74 |
23223 | RICHMOND | $2,748.67 | Allstate | $3,590.82 | State Farm | $3,024.32 | USAA | $2,150.45 | Geico | $2,450.18 |
23224 | RICHMOND | $2,747.43 | Allstate | $3,411.84 | State Farm | $2,883.68 | USAA | $2,103.14 | Nationwide | $2,628.11 |
22039 | FAIRFAX STATION | $2,744.30 | Allstate | $4,023.95 | State Farm | $2,931.58 | Geico | $2,098.38 | USAA | $2,114.40 |
22191 | WOODBRIDGE | $2,741.58 | Allstate | $4,042.10 | State Farm | $2,784.49 | USAA | $2,135.48 | Nationwide | $2,235.10 |
22204 | ARLINGTON | $2,741.36 | Allstate | $4,184.46 | State Farm | $2,721.45 | USAA | $2,138.14 | Geico | $2,352.28 |
22026 | DUMFRIES | $2,739.74 | Allstate | $3,998.75 | Progressive | $2,915.52 | USAA | $2,098.46 | Nationwide | $2,235.10 |
Auto Insurance Rates by City in Virginia
In case you want to understand how much rates vary from the average premium of $2,357, you can do the comparisons from the tables below.
For newcomers to Virginia, this can be an important consideration before buying or renting a house in a specific city or zip code.
Cheapest Cities in Virginia | Average by City | Most Expensive Company | Most Expensive Rate | 2nd Most Expensive Company | 2nd Most Expensive Rate | Cheapest Company | Cheapest Rate | 2nd Cheapest Company | 2nd Cheapest Rate |
---|---|---|---|---|---|---|---|---|---|
East Lexington | $2,018.13 | Allstate | $3,002.04 | Progressive | $2,054.03 | USAA | $1,638.89 | Nationwide | $1,646.95 |
Broadway | $2,034.01 | Allstate | $3,017.99 | Progressive | $2,048.27 | USAA | $1,624.96 | State Farm | $1,704.15 |
Blacksburg | $2,035.11 | Allstate | $3,021.92 | Progressive | $2,161.26 | USAA | $1,568.22 | Geico | $1,665.52 |
Massanutten | $2,036.30 | Allstate | $2,998.27 | Progressive | $1,964.11 | USAA | $1,624.96 | State Farm | $1,821.75 |
Linville | $2,037.09 | Allstate | $3,017.99 | Progressive | $2,103.54 | USAA | $1,624.96 | State Farm | $1,667.35 |
Timberville | $2,038.95 | Allstate | $3,017.99 | Progressive | $2,131.25 | USAA | $1,624.96 | State Farm | $1,650.81 |
Fishersville | $2,039.10 | Allstate | $3,046.63 | Progressive | $1,949.82 | USAA | $1,631.56 | State Farm | $1,839.59 |
Buena Vista | $2,039.40 | Allstate | $3,002.04 | Progressive | $2,080.60 | USAA | $1,638.89 | Nationwide | $1,646.95 |
Lacey Spring | $2,041.03 | Allstate | $2,998.27 | Progressive | $2,007.60 | USAA | $1,624.96 | State Farm | $1,806.66 |
Christiansburg | $2,042.79 | Allstate | $3,021.92 | State Farm | $2,045.19 | Geico | $1,665.52 | USAA | $1,681.92 |
Bridgewater | $2,043.31 | Allstate | $3,046.63 | Progressive | $1,993.75 | USAA | $1,624.96 | State Farm | $1,785.82 |
Port Republic | $2,046.56 | Allstate | $3,046.63 | Progressive | $1,992.42 | USAA | $1,624.96 | State Farm | $1,806.66 |
Dayton | $2,046.69 | Allstate | $3,046.63 | Progressive | $1,993.64 | USAA | $1,624.96 | State Farm | $1,806.25 |
Mount Crawford | $2,048.17 | Allstate | $3,046.63 | Progressive | $1,957.50 | USAA | $1,624.96 | State Farm | $1,851.24 |
Fulks Run | $2,048.95 | Allstate | $3,017.99 | Progressive | $2,081.09 | USAA | $1,624.96 | State Farm | $1,760.97 |
Pleasant Valley | $2,049.22 | Allstate | $3,017.99 | Progressive | $2,037.02 | USAA | $1,624.96 | State Farm | $1,806.66 |
Belview | $2,050.57 | Allstate | $3,071.64 | Progressive | $2,108.49 | Geico | $1,665.52 | USAA | $1,681.92 |
Bergton | $2,050.97 | Allstate | $3,017.99 | Progressive | $2,086.55 | USAA | $1,624.96 | State Farm | $1,767.64 |
Harrisonburg | $2,053.51 | Allstate | $3,078.46 | Progressive | $1,989.72 | USAA | $1,631.85 | State Farm | $1,812.37 |
Fairfield | $2,053.78 | Allstate | $3,002.04 | Progressive | $2,250.94 | USAA | $1,638.89 | Nationwide | $1,646.95 |
Weyers Cave | $2,055.76 | Allstate | $3,046.63 | Progressive | $2,023.71 | USAA | $1,639.53 | Nationwide | $1,845.67 |
Edinburg | $2,056.80 | Allstate | $3,017.99 | Progressive | $1,984.59 | USAA | $1,629.62 | State Farm | $1,826.20 |
Mount Sidney | $2,057.62 | Allstate | $3,046.63 | Progressive | $2,040.34 | USAA | $1,639.53 | Nationwide | $1,845.67 |
Woodstock | $2,057.97 | Allstate | $3,017.99 | Progressive | $2,008.08 | USAA | $1,629.62 | State Farm | $1,809.79 |
Stuarts Draft | $2,058.53 | Allstate | $2,998.27 | Progressive | $2,130.48 | USAA | $1,623.59 | State Farm | $1,831.82 |
East Lexington and Broadway have the cheapest rates for car insurance, while Bailey’s Crossroads and Kings Park have the most expensive rates.
Most Expensive Cities in Virginia | Average by City | Most Expensive Company | Most Expensive Rate | 2nd Most Expensive Company | 2nd Most Expensive Rate | Cheapest Company | Cheapest Rate | 2nd Cheapest Company | 2nd Cheapest Rate |
---|---|---|---|---|---|---|---|---|---|
Bailey's Crossroads | $2,857.10 | Allstate | $4,305.77 | State Farm | $3,156.56 | Geico | $2,141.17 | USAA | $2,206.52 |
Kings Park | $2,855.78 | Allstate | $4,388.84 | Progressive | $2,953.33 | USAA | $2,169.90 | Geico | $2,352.28 |
Springfield | $2,816.60 | Allstate | $4,305.77 | Progressive | $2,910.33 | USAA | $2,055.48 | Geico | $2,351.37 |
Mount Vernon | $2,806.21 | Allstate | $4,184.46 | State Farm | $2,940.41 | USAA | $2,251.53 | Geico | $2,351.37 |
Fort Belvoir | $2,794.01 | Allstate | $4,184.46 | State Farm | $2,917.93 | USAA | $2,057.33 | Geico | $2,351.37 |
Annandale | $2,778.14 | Allstate | $4,274.61 | Progressive | $2,842.69 | Geico | $2,141.17 | USAA | $2,187.52 |
Merrifield | $2,776.35 | Allstate | $4,348.02 | Progressive | $2,975.48 | Geico | $2,017.21 | USAA | $2,121.40 |
East Highland Park | $2,774.68 | Allstate | $3,567.82 | State Farm | $3,089.59 | USAA | $2,144.19 | Geico | $2,550.75 |
Burke | $2,774.08 | Allstate | $4,224.30 | Progressive | $2,867.75 | USAA | $2,121.81 | Geico | $2,211.23 |
West Mclean | $2,771.74 | Allstate | $4,110.52 | Progressive | $2,848.04 | USAA | $2,170.66 | Geico | $2,403.36 |
Crosspointe | $2,765.25 | Allstate | $4,185.98 | State Farm | $2,894.67 | USAA | $2,117.90 | Geico | $2,224.88 |
Cherry Hill | $2,740.66 | Allstate | $4,020.42 | Progressive | $2,847.16 | USAA | $2,116.97 | Nationwide | $2,235.10 |
Franconia | $2,739.44 | Allstate | $4,184.46 | Progressive | $2,824.75 | USAA | $2,079.92 | Geico | $2,175.74 |
Fleet | $2,738.46 | Allstate | $3,615.05 | Progressive | $3,106.78 | Nationwide | $2,203.40 | USAA | $2,357.54 |
Dumfries | $2,733.77 | Allstate | $3,998.75 | Progressive | $2,827.43 | USAA | $2,162.78 | Nationwide | $2,235.10 |
Dale City | $2,730.84 | Allstate | $4,082.65 | State Farm | $2,867.49 | USAA | $2,121.54 | Nationwide | $2,235.10 |
Huntington | $2,730.54 | Allstate | $4,184.46 | State Farm | $2,786.50 | USAA | $2,109.02 | Geico | $2,175.74 |
Triangle | $2,705.49 | Allstate | $4,092.12 | State Farm | $2,704.39 | USAA | $2,137.00 | Nationwide | $2,235.10 |
Alexandria | $2,696.83 | Allstate | $4,218.44 | State Farm | $2,683.58 | Geico | $2,097.78 | USAA | $2,132.32 |
Fort Hunt | $2,695.93 | Allstate | $4,184.46 | State Farm | $2,731.27 | Geico | $2,005.71 | USAA | $2,243.43 |
County Center | $2,689.81 | Allstate | $4,042.10 | State Farm | $2,635.19 | USAA | $2,162.77 | Nationwide | $2,235.10 |
Fairfax | $2,689.31 | Allstate | $4,095.59 | Progressive | $2,883.13 | USAA | $2,061.59 | Geico | $2,141.54 |
Great Falls | $2,686.17 | Allstate | $4,061.45 | Progressive | $2,571.77 | USAA | $2,188.17 | Nationwide | $2,327.14 |
Fair Lakes | $2,680.83 | Allstate | $4,079.29 | Progressive | $2,709.26 | Geico | $2,098.38 | USAA | $2,107.08 |
Greenway | $2,677.88 | Allstate | $4,061.45 | State Farm | $2,570.86 | Geico | $2,167.21 | USAA | $2,170.66 |
Discover Affordable Insurance Options in Virginia
Explore the most cost-effective insurance choices in key Virginian cities, including Arlington, Newport News, Norfolk, Richmond, and Virginia Beach. Our guide helps you identify the best insurance rates tailored to your locality.
Find the Cheapest Insurance in Your City |
---|
Arlington, VA |
Newport News, VA |
Norfolk, VA |
Richmond, VA |
Virginia Beach, VA |
Enter your ZIP code below to compare auto insurance rates.
Secured with SHA-256 Encryption
Best Car Insurance Companies in Virginia
Researching about car insurance companies is as important as the coverage you’re required to buy for driving.
Because not every insurer offers you the ease of digital interaction, usage-based insurance program, or prompt response on the first notice of loss.
Most consumers expect their auto insurer to settle their accident claims as soon as possible and that’s the only criteria, apart from the premium rates, they look at before buying a policy.
But, there are some fundamental characteristics of any insurance company that you must review before signing the policy documents.
Financial Ratings of the Leading Auto Insurers in Virginia
Financial ratings help us to assess the long-term financial strength of an insurer or the ability to meet its contractual obligations in the future.
If an insurer isn’t financially stable, it might not be able to settle your claims when there’s a need.
The best way to know whether an auto insurer is stable is to check its financial strength ratings from the leading credit rating agencies, such as A.M. Best, Fitch, Kroll Bond Rating Agency (KBRA), Moody’s and Standard & Poor’s.
Each one of these agencies has its own rating standard and principles for assigning a rating, therefore you should check ratings from a couple of these.
For the sake of your convenience, we have collated the A.M. Best ratings, which has a unique focus on the insurance sector, of the leading car insurers in Virginia.
Leading Insurance Providers | A.M. Best Ratings |
---|---|
Geico | A++ |
State Farm Group | A++ |
USAA Group | A++ |
Allstate Insurance Group | A+ |
Progressive Group | A+ |
Nationwide Corp Group | A+ |
Erie Insurance Group | A+ |
Liberty Mutual Group | A |
Travelers Group | A++ |
Virginia Farm Bureau Group | A- |
The financial rating guide of A.M. Best uses a scale to assign ratings symbolically ranging from A++ to D with the financial confidence decreasing as you move down the alphabets.
Consumer Reviews of Auto Insurers in Virginia
These days consumers rarely buy anything without checking online reviews or consulting with their friends & colleagues.
When it comes to auto insurance, you definitely need authentic information about the service standards of an insurer before committing to a policy.
To help you make a decision faster, J.D. Power, a leading marketing information services company, conducts annual surveys to assess the satisfaction level of auto insurance consumers. These consumers are asked to rate insurers on five factors: interaction; policy offerings; price; billing process and policy information; and claims.
The J.D. Power 2019 U.S. Auto Insurance Study found that satisfaction levels amongst customers are at an all-time high nowadays because of the convenience with which they can transact digitally bypassing the agent.
Erie insurance, followed by Geico and the Hartford, received the highest ratings from consumers on a 1,000-point scale.
Fortunately, Geico and Erie are among the leading insurance groups in Virginia with the highest market shares and a financially stable outlook.
Complaint Numbers of Leading Car Insurers in Virginia
Taking a look at the complaint data can give you an idea about what concerns consumers have with a particular insurance company. Also, a high number of complaints signifies unsatisfied customers.
Leading Insurance Providers | Complaint Numbers |
---|---|
Geico | 333 |
State Farm Group | 1482 |
USAA Group | 296 |
Allstate Insurance Group | 163 |
Progressive Group | 120 |
Nationwide Corp Group | 25 |
Erie Insurance Group | 22 |
Liberty Mutual Group | 222 |
Travelers Group | 2 |
Virginia Farm Bureau Group | 1 |
If you want more details of the complaints or wish to check data for some other insurer, the data is provided in the Consumer Insurance Search section on the website of the National Association of Insurance Commissioners.
Auto Premiums by Insurance Carriers in Virginia
Insurance Providers | Average Annual Premiums | Compared to State Average (+/-) | Percentage Change (+/-) |
---|---|---|---|
Allstate P&C | $3,386.82 | $1,028.95 | 30.38% |
Geico General | $2,061.51 | -$296.36 | -14.38% |
Nationwide P&C | $2,073.01 | -$284.86 | -13.74% |
Progressive Advanced | $2,498.55 | $140.68 | 5.63% |
State Farm Mutual Auto | $2,268.92 | -$88.94 | -3.92% |
USAA | $1,858.39 | -$499.47 | -26.88% |
Amongst the leading auto insurance providers in Virginia, USAA, Geico, and Nationwide offer the best rates. Only those who are members of the military and their families can get coverage from USAA which is the cheapest in the state.
Compared to the state average premium of $2,357, Allstate offers quite an expensive option, while Progressive and State Farm are closer to the average.
Auto Insurance Premiums by Commute Rate in Virginia
Insurance Providers | 10 miles commute/ 6000 annual mileage | 25 miles commute/ 12000 annual mileage |
---|---|---|
Allstate | $3,283.86 | $3,489.78 |
Geico | $2,022.99 | $2,100.03 |
Nationwide | $2,073.01 | $2,073.01 |
Progressive | $2,498.55 | $2,498.55 |
State Farm | $2,213.23 | $2,324.61 |
USAA | $1,789.83 | $1,926.95 |
Why are we showing rates for different daily or annual commutes?
Your mileage is taken into consideration while calculating rates, as the more you drive, the more susceptible you are to dangers on the road.
Apart from Nationwide and Progressive, all the other providers in the table are offering a different rate for lower mileage.
Auto Insurance Rates by Coverage Level in Virginia
Insurance Providers | Low | Medium | High |
---|---|---|---|
Allstate | $3,285.84 | $3,387.52 | $3,487.10 |
Geico | $1,982.21 | $2,059.38 | $2,142.93 |
Nationwide | $2,173.17 | $2,052.92 | $1,992.94 |
Progressive | $2,389.08 | $2,470.69 | $2,635.87 |
State Farm | $2,135.49 | $2,265.45 | $2,405.83 |
USAA | $1,783.22 | $1,861.89 | $1,930.06 |
The policy limits you choose have an impact on your rates, lower coverage would cost you the least.
Though it might seem like an easier choice now, having a low coverage can expose you to a much larger financial burden later if the damages from an accident exceed your policy limits.
Auto Insurance Rates by Credit History in Virginia
Insurance Providers | Poor | Fair | Good |
---|---|---|---|
Allstate | $4,125.00 | $3,306.90 | $2,728.56 |
Geico | $2,290.34 | $1,947.09 | $1,947.09 |
Nationwide | $2,455.42 | $1,972.48 | $1,791.14 |
Progressive | $2,786.51 | $2,435.06 | $2,274.08 |
State Farm | $3,226.59 | $2,000.23 | $1,579.95 |
USAA | $2,484.29 | $1,693.24 | $1,397.64 |
Your credit score, if not perfect, can haunt you while buying auto insurance. Sometimes your credit score can have more impact on your rates, than any other factor.
As per Consumer Reports, you could be charged around $1,513 more over the base rate if you have a poor credit score in Virginia. Motorists with an excellent credit score but a DWI have to pay only $985 more than the base rate.
In the comparison table of auto insurance rates, you can see that all insurers charge more from motorists with a poor credit history.
Geico can be a sensible choice for those with a poor and fair credit history as their rates aren’t as high as other providers.
In Virginia, the average vantage score as per the State of Credit survey was 680, better than the national average of 675 in 2017.
Vantage score, which is a consumer credit scoring model, assigns a score between 300 and 850 to individuals and anything above 700 is considered good.
Auto Insurance Rates by Driving Record in Virginia
Insurance Providers | Clean record | With 1 accident | With 1 DUI | With 1 speeding violation |
---|---|---|---|---|
Allstate | $2,532.44 | $4,044.27 | $3,705.98 | $3,264.59 |
Geico | $1,565.25 | $2,032.40 | $3,083.13 | $1,565.25 |
Nationwide | $1,802.52 | $1,802.52 | $2,641.55 | $2,045.46 |
Progressive | $2,134.65 | $2,827.50 | $2,547.17 | $2,484.88 |
State Farm | $2,071.20 | $2,466.65 | $2,268.92 | $2,268.92 |
USAA | $1,439.41 | $1,869.24 | $2,468.83 | $1,656.09 |
The extent of the increase in your premium rates depends on what kind of record you have. Usually, accidents and DUI records lead to a much higher increase than speeding violations.
Some insurers, such as Geico, Nationwide, and USAA charge the highest rates from motorists with a DUI record in Virginia.
If you have a record, State Farm and USAA could be considered for auto insurance as their rates are significantly lower than others.
If you want a rundown of what all affects your premium rates, you can watch this video.
Leading Car Insurance Companies in Virginia
Leading Car Insurance Providers | Direct Written Premiums | Loss Ratio | Market Share |
---|---|---|---|
Geico | $979,950 | 71.20% | 18.04% |
State Farm Group | $923,989 | 66.23% | 17.01% |
USAA Group | $717,325 | 74.59% | 13.21% |
Allstate Insurance Group | $523,325 | 54.37% | 9.64% |
Progressive Group | $492,052 | 64.82% | 9.06% |
Nationwide Corp Group | $426,052 | 59.34% | 7.85% |
Erie Insurance Group | $205,964 | 69.19% | 3.79% |
Liberty Mutual Group | $154,405 | 55.65% | 2.84% |
Travelers Group | $120,565 | 60.00% | 2.22% |
Virginia Farm Bureau Group | $115,612 | 59.08% | 2.13% |
Number of Car Insurers in Virginia
Type of Insurer | Number |
---|---|
Foreign (Out-of-state) | 908 |
Domestic (In-state) | 19 |
Free Auto Insurance Comparison
Enter your ZIP code below to compare auto insurance rates.
Secured with SHA-256 Encryption
State Laws in Virginia
Traffic violations can get you in trouble with the law enforcement which goes into your record and is used by insurance companies to assess your risk factors.
More often than not, a violation record leads to an increase in your premium rates because the probability of you filing a claim rises.
We understand it’s difficult to keep up with the regularly changing state laws related to driving, licensing, and car insurance. That’s why we are devoting a section to refresh your knowledge of state laws.
Car Insurance Laws in Virginia
Apart from traffic laws, it would help to know about some other regulations and laws as a motorist. Many times auto owners miss out on important coverage information because of ignorance.
Let’s look at some of the laws that might be useful to you.
How State Laws for Insurance are Determined
Everything from your rates to tort laws to minimum coverage requirements is influenced by state laws. What you pay in premiums goes through a long process of approval and discussion.
Every state is required to follow a regulation mechanism to implement new rates and the options include – determined by Commissioner; prior approval; modified prior approval; flex rating; file and use; use and file; and no file.
When it comes to tort laws, Virginia follows the at-fault system for determining liability in an accident. This means that if you’re the at-fault driver in an accident, you would be required to pay the damages sustained by the third-party.
Financial responsibility laws that require motorists to buy minimum liability coverage, such as the limit of 25/50/25 in Virginia, are also determined by the state laws.
Windshield Coverage Laws in Virginia
Virginia doesn’t have any specific insurance coverage laws with respect to windshields but it does specify rules related to cracks/chips on windshields.
- Scratches on windshields that are larger than six inches by ¼ inch are not allowed.
- Cracks or chips bigger than 1.5 inches in diameter on the windshield might be dangerous for driving, so aren’t permitted
- Obstructions that limit the driver’s view while driving isn’t permitted
High-Risk Auto Insurance in Virginia
What happens with motorists who consistently accumulate points on their driving record? Initially, insurance providers raise their rates, but at times it gets riskier to insure such motorists.
When a motorist becomes high-risk, they can be denied coverage by insurance providers.
High-risk drivers in Virginia can knock the doors of Virginia Automobile Insurance Plan to get coverage if they are denied insurance by more than two providers in a period of 60 days, albeit at a much higher rate.
What is the Virginia Automobile Insurance Plan?
The Virginia Automobile Insurance Plan (VAIP) was established by the State Corporation Commission in 1945 to provide coverage to those motorists who are unable to obtain insurance in the voluntary market.
In this plan, high-risk drivers are distributed equitably among insurers who are licensed to write insurance in the market of Virginia in proportion to their market share. This practice enables a fair risk-sharing between all insurance providers.
Who are eligible to apply to the program?
A motorist who has been denied coverage is eligible to apply to VAIP provided he/she has a valid Virginia driver’s license and a vehicle registered in the state.
If you want more information about the program, you can write to [email protected] or connect with a local insurance agent.
Auto Insurance Fraud in Virginia
Fraudulent insurance claims (for all types of insurance) are estimated to be around $20 million per year. Any act to deceive the system by lying or concealing information with an intention to gain monetary benefits comes under the purview of insurance fraud.
As per a survey in 2017, almost 10 percent of the auto insurance consumers in America have provided incorrect information to obtain coverage.
Do remember something as small as providing an incorrect address on your application to get better rates is considered fraudulent activity.
To combat fraud, the Virginia State Police has implemented the Stamp Out Program for better awareness and fraud reporting.
How can you help?
If you come across anything that you’re suspicious about, you can submit a confidential tip to the Virginia Stae Police. Any tips that help the police in making arrests against insurance fraud are eligible for cash rewards of up to $25,000.
You also have the option to report any complaints through the fraud reporting system of NAIC.
Statute of Limitation in Virginia
To be fair to everyone, the state laws have stipulated a time limit for bringing a lawsuit against the at-fault party in the event of an accident.
In Virginia, motorists are allowed to file a lawsuit within two years of the accident for personal injury claims and five years for property damage claims.
For wrongful death, the family of the plaintiff is allowed to file a lawsuit within two years of the death (rather than the day of the accident).
Vehicle Licensing Laws in Virginia
Other than keeping adequate insurance coverage, you need to always keep your license updated and abide by any new regulations for licensing.
Real ID in Virginia
By now, you must be aware of the Real ID Act that requires every state to issue Real ID-compliant identification documents to facilitate better security measures for entering certain federal facilities and flying by commercial airlines.
But do you know that from October 2020, you wouldn’t be allowed to enter these restricted facilities or fly without a Real ID license or identification document?
The Department of Motor Vehicles (DMV) in Virginia has started issuing Real ID driver’s licenses for motorists and you can get detailed information in this video.
https://www.youtube.com/watch?v=ZBMndSYvS38
To obtain a Real ID license, you need to visit your local DMV office with the required documents which include:
- Identity proof
- Legal presence proof
- Virginia residency proof (two)
- Social security number proof
- Current driver’s license
Penalties for Driving without Insurance in Virginia
The Virginia DMV liaisons with insurance providers to monitor car insurance coverage of motorists. In this arrangement, providers are required to electronically furnish details of insurance policy and vehicles whenever they add, write, or cancel a policy.
Since the process is electronic, the DMV is able to match the details of registered vehicles with insurance coverage. If there’s a mismatch, auto owners are requested to provide details of insurance coverage.
What happens when the DMV finds out that a vehicle is uninsured?
DMV would suspend any driver’s licenses, registration certification, and license plate associated with the uninsured vehicle. The suspension is revoked only when the auto owner complies with the following:
- Pays the statutory uninsured motorist fee of $500
- Files the form SR-22 which ensures financial responsibility for three years
- May need to pay the reinstatement fee
During these three years, insurance providers are required to notify the DMV if the vehicle owner cancels the insurance coverage.
Teen Driver Laws in Virginia
Teens have to go through a long process to get the freedom to drive by themselves, which usually includes a phase of restricted driving. This phase, known as the learner’s permit, equips them with the necessary road skills to be a safe driver.
Learner’s Permit: Teens can begin the process of getting a permit to drive when they’re at least 15 years and six months old. To get the learner’s permit, you’re required to pass the vision and knowledge test.
To understand the basic rules of the road as a first-time driver, do browse through the Virginia Driver’s Manual.
Since this is the first time you would practice driving, you’re required to follow certain restrictions:
- You can drive only when accompanied by a licensed driver who’s at least 21 years old
- Your accompanying driver can be 18 years old if he/she is your brother, sister, half-brother, half-sister, step-brother, step-sister, or legal guardian
- If you’re at least 16 years and three months old and have held the learner’s permit for nine months, you’re allowed to drive alone. You must also hold a driver’s education certificate signed by a parent or legal guardian
Permanent Driver’s License: When you have held a learner’s permit for at least nine months and completed your driver’s education course, you can apply for a permanent license.
To obtain the license, your parent, foster parent or guardian must certify that you practiced 45 hours of driving including 15 hours of nighttime driving.
If you’re under 18 years old, certain restrictions still apply to you:
- The law restricts driving between the hours of 12 a.m. to 4 a.m. unless when you’re driving for employment, school activity, emergency or when accompanied by a licensed spouse above the age of 18 or a parent
- You are allowed to drive with only one person who’s younger than 21, except when your licensed parent or another adult is riding with you in the car. After holding the license for at least one year, you’re allowed to drive with three passengers under the age of 21 when traveling for a school activity or an emergency or when accompanied by a licensed adult driver above 21
- Holders of learner’s permit can not carry more than one passenger below the age of 18
Passenger restrictions are not applicable on family members of the driver.
License Renewal Procedure in Virginia
In Virginia, the driver’s license for motorists below the age of 75 is valid for eight years. For those who are 75 and above, the license is valid for five years.
How can you renew your license?
The Virginia DMV sends a mail for renewal of license before the expiration date and you can also opt for electronic renewal reminders.
This renewal notice clearly states whether you’re eligible for an online or mail renewal, otherwise, you would have to go to the customer service center.
You also have the option to renew your license in one of the DMV’s mobile office as well.
New Residents in Virginia
Moving to a new state is exciting, especially if it’s to Virginia which is for lovers. That sounds corny, but it’s the state’s official slogan and it truly is a wonderful place to be.
We know that with a new move comes a whole lot of paperwork. Here are a few things you need to ensure, related to your car and insurance coverage, after your move to Virginia.
- You must obtain a vehicle inspection safety sticker to drive in Virginia
- You have to get an emissions inspection certificate for your vehicle before registration if you’re living in the counties of Arlington, Fairfax, Loudoun, Prince William, or Stafford or in the cities of Alexandria, Fairfax, Falls Church, Manassas, or Manassas Park. Emissions certificate obtained in the last one year are also valid if you’re registering your vehicle for the first time
- You have to meet the car insurance liability coverage requirement of 25/50/20 in Virginia
- You must get the vehicle title in Virginia within 30 days of your move, after which you can register it and obtain license plates
Rules of the Road in Virginia
You must have read about the rules that you need to follow while driving when you first browsed through the DMV manual for a knowledge test. If you keep brushing up your knowledge once in a while, it keeps you more aware.
We wouldn’t bore you with a lot of details, just a few basic rules that help in day to day driving.
Also, there are some unwritten rules of the road such as looking out for the blind spots, do make sure that you educate first-time drivers about this.
Fault vs No-Fault Law in Virginia
Virginia follows the tort system for determining financial responsibility in the event of a car accident which requires the at-fault driver to pay for the injuries and damages sustained by the third-party.
The mandatory liability coverage protects you from the costs of damages and lawsuits if you hit someone on the road, and that’s why it’s recommended to at least get liability insurance.
Seat Belt and Car Seat Laws in Virginia
Seat belts can considerably reduce the risk of serious injury in an accident and the laws of Virginia require all front-seat passengers to wear a seat belt when the car is in motion.
In addition, the driver of any vehicle must ensure that passengers below the age of 18 are properly secured by a seat belt or a child safety seat. Children under the age of 8 should be secured in a booster or child safety seat.
Laws in Virginia recommend motorists to use a child restraint system that’s suitable for the age, height, and weight of your child.
You can follow the recommendations of the American Academy of Pediatrics (AAP) and the National Highway Traffic Safety Administration (NHTSA) for appropriate car seats which are:
- Until the age of two, all children should be restrained in a rear-facing car seat and follow the instructions provided by the seat manufacturer
- When the child reaches the maximum weight as per the seat manufacturer’s instructions or weighs a minimum of 20 pounds, you can use a forward-facing seat
- To transition your child to a booster seat, make sure that your child doesn’t fit in the car seat anymore or exceeds the height and weight specifications of the car seat. Children should be restrained in a booster seat until the age of 8 or when they’re 4 feet 9 inches tall
- Once the children are at least 8, you can restrain them using a seat belt provided it protects them comfortably
Penalties for violating the car seat law
If your child isn’t safely restrained in a car seat, you would be fined $50 for the first violation. Any subsequent violations can lead to a fine of $500.
Keep Right and Move Over Laws in Virginia
In July 2017, Virginia passed a law that prohibits motorists from driving on the left lane if they’re moving slower than the speed limit or staying on the left lane unless to use it for passing or taking a turn.
The fine for being fixated on the left lane is $100 and quite a few motorists were caught for violation in the first year of the law’s enforcement.
As much as keeping on the left lane is dangerous, passing a stationary emergency vehicle from its adjacent lane can prove fatal.
The move over law in Virginia requires motorists to change their lane by moving away from an emergency vehicle that’s parked on the side of a highway with flashing or blinking lights.
Speed Limits in Virginia
Although speed limits are posted on all roads, you have to follow the following limits if it’s not posted.
Type of Road | Speed Limit |
---|---|
Highways | 55 mph |
Route 600 or above (trucks) | 45 mph |
Business and residential districts | 25 mph |
Unpaved roads | 35 mph |
Ridesharing Laws in Virginia
In an effort to make ridesharing safe for drivers and passengers, every other state in America has implemented a separate ridesharing law or are currently discussing how to regulate the operation of Transport Network Companies (TNC) like Uber and Lyft.
Fortunately, Virginia signed a ridesharing law quite early in 2015 that mandates background checks for drivers and minimum insurance requirements. The law specifically intended to make sure that drivers are vetted stringently before being allowed to drive.
The new law also requires TNC vehicles to maintain a minimum liability insurance coverage of $1 million.
Automation on the Road in Virginia
Considering the mishaps witnessed during automated vehicle testing in America, lawmakers in most of the states are slightly skeptical about making policies that allow driverless cars on the road.
Virginiadoes allow testing of autonomous vehicles with a safety driver but still doesn’t have clear policies on automation. Nonetheless, it’s enthusiastic about the idea of driverless vehicles that would provide more safety to people in the future.
In 2015, Gov. McAuliffe announced the development of Virginia Automated Corridors that would offer the necessary infrastructure to test automated vehicles.
Local governments in Albemarle and Montogomery county have accelerated the growth of automated vehicle testing by offering assistance and support to manufacturers such as Perrone Robotics and Torc Robotics, respectively.
Safety Laws in Virginia
Distracted driving and driving under the influence of alcohol or drugs isn’t just illegal but can be fatal. Let’s look at what measures are taken in Virginia to promote responsible driving behavior.
DUI Laws in Virginia
Any motorists driving with a Blood Alcohol Level of 0.08 percent or more is considered to be driving under the influence of alcohol.
Penalties in Virginia for drunk or drugged driving are quite strict and the punishments get harsher on subsequent offenses.
What are the penalties for DUI in Virginia?
- First Offense: You would have to pay a minimum fine of $250 and your driver’s license would be revoked for one year
- Second Offense: You would have to pay a minimum fine of $500 and your driver’s license would be revoked for three years with a possibility of a prison term up to one year
- Third Offense: You would have to pay a minimum fine of $1,000 and your driver’s license would be revoked for an indefinite period. You will also face prosecution as a Class 6 felon
- Fourth or Subsequent Offense: You would face a minimum prison term of one year
That’s not all though, you would face additional penalties depending on the frequency of offenses within certain time periods.
- If you’re convicted of DUI for the second time within ten years of the previous conviction, you would have to face a minimum prison term of 10 days. And, if the second offense is within five years, you would have to spend a minimum of 20 days in prison.
- For the third conviction within five years, there’s a mandatory minimum prison term of six months. And, if it’s within ten years, your vehicle would be forfeited and you would have to spend at least 90 days in prison.
The law also adds more penalties when your BAC level is more than 0.15 percent or 0.20 percent. Driving with children while intoxicated or on a suspended license due to DUI would further make your life difficult.
Distracted Driving Laws in Virginia
Distracted driving can involve texting, talking on the phone, looking outside, chatting with co-passengers, or basically anything that takes your mind off the road.
Though you’re allowed to engage in chit-chatting or enjoying the scenic views outside while driving, it might lead to an accident. Therefore, it’s recommended to focus on driving completely.
Virginia bans texting while driving for all motorists and any violation is a primary offense. For the first violation, you would be fined $125 and for subsequent offenses, you have to pay $250 in fines.
Lawmakers in Virginia are also planning to ban holding a phone for a call while driving.
Driving in Virginia
Despite the laws and regulations, we hear about accidents and fatalities regularly. These events not only raise the premium rates in a state but also makes it dangerous to drive.
We are including facts and figures about the most common types of accidents and what causes them so that you can be more careful on the roads.
Vehicle Theft in Virginia
Rank | Make & Model | Year of Vehicle | Number of Thefts |
---|---|---|---|
1 | Honda Accord | 2002 | 266 |
2 | Ford Pickup (Full Size) | 2004 | 205 |
3 | Honda Civic | 2013 | 200 |
4 | Toyota Camry | 2014 | 181 |
5 | Nissan Altima | 2015 | 162 |
6 | Chevrolet Pickup (Full Size) | 2003 | 144 |
7 | Toyota Corolla | 2013 | 140 |
8 | Ford Explorer | 2002 | 119 |
9 | Jeep Cherokee/Grand Cherokee | 2001 | 107 |
10 | Chevrolet Impala | 2006 | 105 |
If you want to see the theft numbers in your city, you can search in the table below which has been sourced from the FBI.
City | Motor vehicle theft |
---|---|
Abingdon | 9 |
Alexandria | 273 |
Altavista | 4 |
Amherst | 1 |
Appalachia | 0 |
Ashland | 6 |
Bedford | 7 |
Berryville | 1 |
Big Stone Gap | 3 |
Blacksburg | 10 |
Blackstone | 8 |
Bluefield | 1 |
Bridgewater | 0 |
Bristol | 48 |
Broadway | 0 |
Brookneal | 1 |
Burkeville | 1 |
Cape Charles | 0 |
Cedar Bluff | 1 |
Charlottesville | 71 |
Chase City | 6 |
Chatham | 0 |
Chesapeake | 250 |
Chilhowie | 0 |
Chincoteague | 2 |
Clarksville | 0 |
Clifton Forge | 3 |
Clintwood | 0 |
Coeburn | 4 |
Colonial Beach | 4 |
Colonial Heights | 15 |
Covington | 3 |
Crewe | 4 |
Culpeper | 19 |
Damascus | 1 |
Danville | 98 |
Dayton | 0 |
Dublin | 2 |
Dumfries | 6 |
Elkton | 3 |
Emporia | 5 |
Exmore | 0 |
Fairfax City | 17 |
Falls Church | 9 |
Farmville | 10 |
Franklin | 17 |
Fredericksburg | 51 |
Galax | 17 |
Gate City | 3 |
Glade Spring | 1 |
Glasgow | 0 |
Glen Lyn | 0 |
Gordonsville | 1 |
Gretna | 1 |
Grottoes | 0 |
Grundy | 1 |
Halifax | 2 |
Hampton | 332 |
Harrisonburg | 43 |
Haymarket | 1 |
Haysi | 0 |
Herndon | 9 |
Hillsville | 5 |
Honaker | 1 |
Hopewell | 57 |
Hurt | 0 |
Independence | 2 |
Jonesville | 0 |
Kenbridge | 0 |
Kilmarnock | 5 |
La Crosse | 0 |
Lebanon | 5 |
Lexington | 1 |
Louisa | 0 |
Luray | 4 |
Lynchburg | 140 |
Manassas | 39 |
Manassas Park | 11 |
Marion | 16 |
Martinsville | 21 |
Middleburg | 1 |
Middletown | 1 |
Mount Jackson | 0 |
Narrows | 0 |
New Market | 0 |
Newport News | 488 |
Norfolk | 718 |
Norton | 6 |
Occoquan | 0 |
Onancock | 2 |
Onley | 0 |
Orange | 7 |
Parksley | 0 |
Pearisburg | 3 |
Pembroke | 2 |
Pennington Gap | 0 |
Petersburg | 113 |
Pocahontas | 0 |
Poquoson | 0 |
Portsmouth | 384 |
Pound | 3 |
Pulaski | 14 |
Purcellville | 3 |
Quantico | 0 |
Radford | 6 |
Rich Creek | 1 |
Richlands | 3 |
Roanoke | 287 |
Rocky Mount | 4 |
Rural Retreat | 0 |
Salem | 44 |
Saltville | 3 |
Shenandoah | 2 |
Smithfield | 7 |
South Boston | 8 |
South Hill | 5 |
Stanley | 2 |
Staunton | 18 |
Stephens City | 1 |
St. Paul | 2 |
Strasburg | 1 |
Suffolk | 97 |
Tappahannock | 2 |
Tazewell | 2 |
Timberville | 0 |
Victoria | 1 |
Vienna | 3 |
Vinton | 13 |
Virginia Beach | 459 |
Warrenton | 5 |
Warsaw | 1 |
Waverly | 3 |
Waynesboro | 23 |
Weber City | 0 |
West Point | 2 |
White Stone | 0 |
Williamsburg | 13 |
Winchester | 23 |
Windsor | 0 |
Wise | 3 |
Woodstock | 6 |
Wytheville | 10 |
Road Fatalities in Virginia
We have sourced data from the National Highway Traffic Safety Administration to offer you insights on crashes by counties or cities.
Most Fatal Highway in Virginia
Route US-460 is the deadliest highway in Virginia which registers around 19 crashes every year.
Fatal Crashes by Weather Condition and Light Condition in Virginia
Weather Condition | Daylight | Dark, but Lighted | Dark | Dawn or Dusk | Other / Unknown | Total |
---|---|---|---|---|---|---|
Normal | 0 | 0 | 0 | 0 | 0 | 0 |
Rain | 27 | 15 | 25 | 4 | 1 | 72 |
Snow/Sleet | 1 | 0 | 2 | 0 | 0 | 3 |
Other | 2 | 1 | 2 | 2 | 0 | 7 |
Unknown | 394 | 83 | 196 | 28 | 0 | 701 |
Total | 424 | 99 | 225 | 34 | 1 | 783 |
Fatalities (All Crashes) by County in Virginia
County Name | 2013 | 2014 | 2015 | 2016 | 2017 |
---|---|---|---|---|---|
Accomack County | 8 | 10 | 6 | 8 | 3 |
Albemarle County | 11 | 16 | 15 | 9 | 12 |
Alexandria City | 3 | 0 | 4 | 4 | 4 |
Alleghany County | 4 | 5 | 3 | 4 | 2 |
Amelia County | 4 | 1 | 3 | 5 | 7 |
Amherst County | 4 | 8 | 6 | 5 | 4 |
Appomattox County | 2 | 4 | 1 | 3 | 2 |
Arlington County | 2 | 8 | 5 | 1 | 5 |
Augusta County | 17 | 9 | 9 | 19 | 18 |
Bath County | 1 | 1 | 0 | 1 | 1 |
Bedford City | 0 | 0 | 0 | 0 | 0 |
Bedford County | 9 | 7 | 6 | 14 | 17 |
Bland County | 1 | 1 | 1 | 1 | 2 |
Botetourt County | 4 | 5 | 8 | 4 | 4 |
Bristol City | 2 | 1 | 0 | 0 | 0 |
Brunswick County | 11 | 9 | 6 | 7 | 5 |
Buchanan County | 7 | 3 | 6 | 3 | 6 |
Buckingham County | 1 | 11 | 2 | 8 | 7 |
Buena Vista City | 0 | 0 | 0 | 0 | 0 |
Campbell County | 4 | 9 | 7 | 11 | 8 |
Caroline County | 14 | 1 | 10 | 12 | 7 |
Carroll County | 11 | 4 | 7 | 6 | 8 |
Charles City County | 0 | 3 | 3 | 4 | 0 |
Charlotte County | 3 | 2 | 7 | 6 | 0 |
Charlottesville City | 1 | 0 | 0 | 2 | 0 |
Chesapeake City | 11 | 9 | 18 | 19 | 18 |
Chesterfield County | 26 | 19 | 28 | 25 | 34 |
Clarke County | 0 | 1 | 7 | 3 | 3 |
Clifton Forge City | 0 | 0 | 0 | 0 | 0 |
Colonial Heights City | 0 | 0 | 1 | 5 | 1 |
Covington City | 1 | 1 | 0 | 0 | 0 |
Craig County | 4 | 0 | 2 | 0 | 0 |
Culpeper County | 9 | 9 | 6 | 5 | 5 |
Cumberland County | 4 | 1 | 1 | 1 | 4 |
Danville City | 6 | 2 | 3 | 4 | 4 |
Dickenson County | 2 | 2 | 3 | 1 | 1 |
Dinwiddie County | 8 | 3 | 10 | 9 | 9 |
Emporia City | 1 | 1 | 0 | 0 | 0 |
Essex County | 1 | 5 | 3 | 3 | 3 |
Fairfax City | 2 | 0 | 0 | 4 | 0 |
Fairfax County | 40 | 33 | 31 | 34 | 34 |
Falls Church City | 0 | 0 | 0 | 0 | 0 |
Fauquier County | 6 | 9 | 19 | 15 | 9 |
Floyd County | 4 | 3 | 3 | 1 | 1 |
Fluvanna County | 6 | 3 | 7 | 0 | 6 |
Franklin City | 0 | 0 | 0 | 2 | 0 |
Franklin County | 8 | 7 | 7 | 16 | 12 |
Frederick County | 11 | 9 | 13 | 10 | 22 |
Fredericksburg City | 2 | 0 | 2 | 1 | 2 |
Galax City | 0 | 0 | 1 | 0 | 0 |
Giles County | 5 | 9 | 4 | 1 | 5 |
Gloucester County | 3 | 4 | 5 | 5 | 7 |
Goochland County | 5 | 3 | 9 | 2 | 5 |
Grayson County | 1 | 3 | 3 | 3 | 0 |
Greene County | 2 | 3 | 1 | 0 | 3 |
Greensville County | 2 | 7 | 2 | 5 | 2 |
Halifax County | 3 | 8 | 9 | 12 | 9 |
Hampton City | 9 | 10 | 8 | 8 | 8 |
Hanover County | 13 | 17 | 15 | 8 | 13 |
Harrisonburg City | 1 | 0 | 1 | 4 | 1 |
Henrico County | 24 | 18 | 18 | 21 | 24 |
Henry County | 10 | 13 | 16 | 13 | 13 |
Highland County | 0 | 1 | 0 | 1 | 0 |
Hopewell City | 1 | 2 | 1 | 0 | 0 |
Isle Of Wight County | 7 | 9 | 2 | 4 | 4 |
James City County | 8 | 5 | 8 | 4 | 15 |
King And Queen County | 1 | 2 | 3 | 2 | 4 |
King George County | 8 | 11 | 5 | 6 | 9 |
King William County | 3 | 3 | 1 | 3 | 3 |
Lancaster County | 4 | 1 | 2 | 4 | 3 |
Lee County | 4 | 2 | 7 | 5 | 3 |
Lexington City | 2 | 0 | 0 | 0 | 0 |
Loudoun County | 13 | 12 | 11 | 12 | 21 |
Louisa County | 12 | 3 | 6 | 10 | 7 |
Lunenburg County | 3 | 3 | 1 | 3 | 5 |
Lynchburg City | 1 | 3 | 2 | 1 | 2 |
Madison County | 1 | 1 | 3 | 1 | 3 |
Manassas City | 0 | 0 | 0 | 0 | 2 |
Manassas Park City | 0 | 0 | 0 | 0 | 0 |
Martinsville City | 1 | 0 | 0 | 0 | 0 |
Mathews County | 6 | 1 | 1 | 2 | 2 |
Mecklenburg County | 11 | 9 | 6 | 8 | 10 |
Middlesex County | 1 | 2 | 2 | 1 | 2 |
Montgomery County | 9 | 4 | 6 | 5 | 13 |
Nelson County | 4 | 2 | 7 | 0 | 4 |
New Kent County | 4 | 8 | 8 | 5 | 3 |
Newport News City | 10 | 11 | 15 | 17 | 16 |
Norfolk City | 25 | 21 | 15 | 18 | 19 |
Northampton County | 1 | 3 | 3 | 9 | 3 |
Northumberland County | 2 | 2 | 1 | 2 | 1 |
Norton City | 1 | 0 | 0 | 0 | 0 |
Nottoway County | 3 | 4 | 5 | 5 | 3 |
Orange County | 8 | 6 | 6 | 6 | 8 |
Page County | 1 | 2 | 3 | 4 | 3 |
Patrick County | 6 | 4 | 4 | 1 | 6 |
Petersburg City | 2 | 3 | 0 | 6 | 2 |
Pittsylvania County | 8 | 16 | 19 | 14 | 14 |
Poquoson City | 0 | 0 | 2 | 0 | 0 |
Portsmouth City | 3 | 5 | 5 | 8 | 13 |
Powhatan County | 7 | 5 | 4 | 1 | 4 |
Prince Edward County | 6 | 4 | 7 | 5 | 7 |
Prince George County | 10 | 6 | 13 | 3 | 6 |
Prince William County | 18 | 23 | 11 | 30 | 22 |
Pulaski County | 4 | 9 | 2 | 2 | 9 |
Radford City | 0 | 1 | 1 | 0 | 2 |
Rappahannock County | 0 | 0 | 0 | 0 | 3 |
Richmond City | 12 | 9 | 13 | 16 | 21 |
Richmond County | 0 | 1 | 1 | 4 | 1 |
Roanoke City | 6 | 7 | 4 | 9 | 12 |
Roanoke County | 9 | 4 | 10 | 5 | 8 |
Rockbridge County | 2 | 9 | 7 | 9 | 8 |
Rockingham County | 12 | 18 | 10 | 12 | 12 |
Russell County | 4 | 1 | 9 | 6 | 8 |
Salem City | 1 | 0 | 1 | 0 | 2 |
Scott County | 3 | 3 | 3 | 2 | 4 |
Shenandoah County | 7 | 4 | 7 | 6 | 4 |
Smyth County | 5 | 4 | 4 | 3 | 3 |
South Boston City (No Longer A County Equivalent) | 0 | 0 | 0 | 0 | 0 |
Southampton County | 9 | 4 | 5 | 2 | 4 |
Spotsylvania County | 11 | 11 | 11 | 14 | 12 |
Stafford County | 8 | 5 | 15 | 9 | 9 |
Staunton City | 1 | 0 | 1 | 1 | 0 |
Suffolk City | 14 | 12 | 15 | 7 | 18 |
Surry County | 1 | 1 | 2 | 3 | 1 |
Sussex County | 0 | 4 | 3 | 8 | 13 |
Tazewell County | 6 | 4 | 5 | 3 | 5 |
Virginia Beach City | 27 | 29 | 16 | 19 | 25 |
Warren County | 5 | 8 | 4 | 7 | 6 |
Washington County | 6 | 8 | 9 | 6 | 8 |
Waynesboro City | 2 | 1 | 1 | 1 | 1 |
Westmoreland County | 0 | 3 | 5 | 0 | 2 |
Williamsburg City | 0 | 0 | 0 | 0 | 0 |
Winchester City | 0 | 0 | 1 | 1 | 0 |
Wise County | 8 | 5 | 4 | 6 | 1 |
Wythe County | 4 | 4 | 14 | 6 | 10 |
York County | 4 | 5 | 5 | 9 | 5 |
Traffic Fatalities in Virginia
Road Type | 2008 | 2009 | 2010 | 2011 | 2012 | 2013 | 2014 | 2015 | 2016 | 2017 |
---|---|---|---|---|---|---|---|---|---|---|
Rural | 479 | 421 | 308 | 405 | 500 | 473 | 448 | 484 | 477 | 519 |
Urban | 343 | 334 | 234 | 279 | 259 | 260 | 247 | 269 | 281 | 319 |
Fatalities by Person Type in Virginia
Person Type | 2013 | 2014 | 2015 | 2016 | 2017 |
---|---|---|---|---|---|
Passenger Car | 331 | 299 | 323 | 308 | 320 |
Light Truck - Pickup | 87 | 86 | 103 | 82 | 111 |
Light Truck - Utility | 99 | 68 | 103 | 88 | 111 |
Light Truck - Van | 32 | 23 | 24 | 30 | 32 |
Large Truck | 24 | 22 | 19 | 25 | 18 |
Bus | 1 | 1 | 0 | 0 | 0 |
Other/Unknown Occupants | 1 | 10 | 8 | 8 | 5 |
Total Occupants | 575 | 509 | 581 | 547 | 597 |
Light Truck - Other | 0 | 0 | 1 | 6 | 0 |
Total Motorcyclists | 79 | 90 | 79 | 79 | 117 |
Pedestrian | 75 | 88 | 77 | 122 | 111 |
Bicyclist and Other Cyclist | 8 | 12 | 15 | 10 | 12 |
Other/Unknown Nonoccupants | 3 | 4 | 2 | 2 | 2 |
Total Nonoccupants | 86 | 104 | 94 | 134 | 125 |
Total | 740 | 703 | 754 | 760 | 839 |
Fatalities by Crash Type in Virginia
Crash Type | 2013 | 2014 | 2015 | 2016 | 2017 |
---|---|---|---|---|---|
Total Fatalities (All Crashes) | 740 | 703 | 754 | 760 | 839 |
Single Vehicle | 461 | 436 | 474 | 476 | 493 |
Involving a Large Truck | 89 | 90 | 71 | 91 | 98 |
Involving Speeding | 132 | 99 | 105 | 257 | 219 |
Involving a Rollover | 188 | 146 | 194 | 163 | 186 |
Involving a Roadway Departure | 498 | 443 | 492 | 444 | 511 |
Involving an Intersection (or Intersection Related) | 138 | 164 | 170 | 177 | 189 |
Fatalities Trend for the Top 10 Counties in Virginia
Virginia Counties by 2017 Ranking | 2013 | 2014 | 2015 | 2016 | 2017 |
---|---|---|---|---|---|
Chesterfield County | 26 | 19 | 28 | 25 | 34 |
Fairfax County | 40 | 33 | 31 | 34 | 34 |
Virginia Beach City | 27 | 29 | 16 | 19 | 25 |
Henrico County | 24 | 18 | 18 | 21 | 24 |
Frederick County | 11 | 9 | 13 | 10 | 22 |
Prince William County | 18 | 23 | 11 | 30 | 22 |
Loudoun County | 13 | 12 | 11 | 12 | 21 |
Richmond City | 12 | 9 | 13 | 16 | 21 |
Norfolk City | 25 | 21 | 15 | 18 | 19 |
Augusta County | 17 | 9 | 9 | 19 | 18 |
Top Ten Counties | 218 | 210 | 195 | 218 | 240 |
All Other Counties | 522 | 493 | 559 | 541 | 599 |
All Counties | 740 | 703 | 754 | 759 | 839 |
Fatalities Involving Speeding by County in Virginia
County Name | 2013 | 2014 | 2015 | 2016 | 2017 |
---|---|---|---|---|---|
Accomack County | 1 | 0 | 1 | 3 | 2 |
Albemarle County | 2 | 0 | 1 | 2 | 2 |
Alexandria City | 0 | 0 | 1 | 1 | 2 |
Alleghany County | 0 | 1 | 2 | 1 | 0 |
Amelia County | 1 | 1 | 0 | 3 | 5 |
Amherst County | 1 | 1 | 1 | 2 | 1 |
Appomattox County | 0 | 0 | 0 | 1 | 0 |
Arlington County | 0 | 1 | 2 | 0 | 0 |
Augusta County | 3 | 3 | 3 | 5 | 5 |
Bath County | 0 | 0 | 0 | 0 | 0 |
Bedford City | 0 | 0 | 0 | 0 | 0 |
Bedford County | 2 | 0 | 0 | 8 | 6 |
Bland County | 1 | 0 | 0 | 0 | 0 |
Botetourt County | 0 | 0 | 0 | 2 | 0 |
Bristol City | 1 | 0 | 0 | 0 | 0 |
Brunswick County | 1 | 2 | 0 | 2 | 2 |
Buchanan County | 3 | 1 | 4 | 1 | 2 |
Buckingham County | 1 | 3 | 0 | 6 | 1 |
Buena Vista City | 0 | 0 | 0 | 0 | 0 |
Campbell County | 0 | 3 | 1 | 5 | 4 |
Caroline County | 1 | 0 | 0 | 7 | 2 |
Carroll County | 2 | 1 | 0 | 0 | 3 |
Charles City County | 0 | 0 | 1 | 2 | 0 |
Charlotte County | 1 | 0 | 0 | 2 | 0 |
Charlottesville City | 0 | 0 | 0 | 1 | 0 |
Chesapeake City | 2 | 0 | 2 | 5 | 6 |
Chesterfield County | 2 | 3 | 8 | 14 | 8 |
Clarke County | 0 | 0 | 0 | 1 | 1 |
Clifton Forge City | 0 | 0 | 0 | 0 | 0 |
Colonial Heights City | 0 | 0 | 0 | 1 | 0 |
Covington City | 0 | 0 | 0 | 0 | 0 |
Craig County | 0 | 0 | 0 | 0 | 0 |
Culpeper County | 1 | 0 | 0 | 1 | 0 |
Cumberland County | 0 | 1 | 0 | 0 | 3 |
Danville City | 1 | 0 | 0 | 0 | 1 |
Dickenson County | 2 | 1 | 1 | 0 | 1 |
Dinwiddie County | 2 | 0 | 1 | 2 | 3 |
Emporia City | 1 | 0 | 0 | 0 | 0 |
Essex County | 0 | 1 | 0 | 1 | 0 |
Fairfax City | 0 | 0 | 0 | 1 | 0 |
Fairfax County | 9 | 7 | 8 | 12 | 14 |
Falls Church City | 0 | 0 | 0 | 0 | 0 |
Fauquier County | 1 | 1 | 2 | 6 | 2 |
Floyd County | 0 | 0 | 0 | 0 | 0 |
Fluvanna County | 0 | 0 | 2 | 0 | 0 |
Franklin City | 0 | 0 | 0 | 0 | 0 |
Franklin County | 0 | 0 | 0 | 4 | 3 |
Frederick County | 2 | 0 | 2 | 1 | 4 |
Fredericksburg City | 0 | 0 | 0 | 1 | 0 |
Galax City | 0 | 0 | 0 | 0 | 0 |
Giles County | 1 | 1 | 1 | 0 | 0 |
Gloucester County | 0 | 0 | 2 | 1 | 1 |
Goochland County | 0 | 0 | 5 | 0 | 0 |
Grayson County | 0 | 0 | 0 | 1 | 0 |
Greene County | 1 | 1 | 0 | 0 | 0 |
Greensville County | 0 | 0 | 0 | 2 | 1 |
Halifax County | 0 | 1 | 0 | 3 | 2 |
Hampton City | 2 | 3 | 3 | 1 | 2 |
Hanover County | 2 | 0 | 1 | 5 | 4 |
Harrisonburg City | 0 | 0 | 0 | 0 | 1 |
Henrico County | 3 | 1 | 1 | 6 | 0 |
Henry County | 0 | 2 | 2 | 4 | 6 |
Highland County | 0 | 0 | 0 | 0 | 0 |
Hopewell City | 0 | 0 | 0 | 0 | 0 |
Isle Of Wight County | 2 | 2 | 0 | 0 | 1 |
James City County | 1 | 0 | 0 | 1 | 3 |
King And Queen County | 0 | 1 | 0 | 0 | 2 |
King George County | 0 | 2 | 0 | 3 | 5 |
King William County | 0 | 0 | 0 | 2 | 1 |
Lancaster County | 0 | 0 | 0 | 1 | 2 |
Lee County | 1 | 2 | 1 | 2 | 0 |
Lexington City | 0 | 0 | 0 | 0 | 0 |
Loudoun County | 3 | 2 | 2 | 5 | 10 |
Louisa County | 3 | 1 | 0 | 7 | 3 |
Lunenburg County | 1 | 1 | 0 | 2 | 1 |
Lynchburg City | 0 | 0 | 0 | 0 | 1 |
Madison County | 0 | 0 | 0 | 0 | 1 |
Manassas City | 0 | 0 | 0 | 0 | 0 |
Manassas Park City | 0 | 0 | 0 | 0 | 0 |
Martinsville City | 1 | 0 | 0 | 0 | 0 |
Mathews County | 0 | 0 | 0 | 0 | 0 |
Mecklenburg County | 2 | 0 | 1 | 2 | 3 |
Middlesex County | 0 | 1 | 0 | 0 | 0 |
Montgomery County | 1 | 1 | 2 | 0 | 5 |
Nelson County | 0 | 0 | 2 | 0 | 1 |
New Kent County | 4 | 0 | 1 | 3 | 0 |
Newport News City | 1 | 3 | 5 | 7 | 6 |
Norfolk City | 7 | 5 | 3 | 2 | 0 |
Northampton County | 0 | 0 | 1 | 0 | 1 |
Northumberland County | 0 | 0 | 0 | 1 | 0 |
Norton City | 0 | 0 | 0 | 0 | 0 |
Nottoway County | 0 | 0 | 0 | 3 | 2 |
Orange County | 1 | 1 | 0 | 2 | 0 |
Page County | 0 | 0 | 0 | 3 | 2 |
Patrick County | 0 | 0 | 1 | 0 | 0 |
Petersburg City | 1 | 0 | 0 | 2 | 0 |
Pittsylvania County | 2 | 1 | 1 | 4 | 4 |
Poquoson City | 0 | 0 | 0 | 0 | 0 |
Portsmouth City | 0 | 2 | 0 | 4 | 1 |
Powhatan County | 1 | 0 | 0 | 0 | 1 |
Prince Edward County | 0 | 0 | 0 | 2 | 4 |
Prince George County | 0 | 0 | 0 | 0 | 1 |
Prince William County | 4 | 6 | 2 | 14 | 9 |
Pulaski County | 1 | 0 | 0 | 0 | 1 |
Radford City | 0 | 0 | 0 | 0 | 0 |
Rappahannock County | 0 | 0 | 0 | 0 | 1 |
Richmond City | 2 | 0 | 1 | 5 | 2 |
Richmond County | 0 | 0 | 0 | 1 | 1 |
Roanoke City | 2 | 0 | 4 | 2 | 3 |
Roanoke County | 3 | 1 | 0 | 2 | 2 |
Rockbridge County | 0 | 2 | 0 | 3 | 1 |
Rockingham County | 5 | 5 | 2 | 5 | 4 |
Russell County | 1 | 0 | 2 | 1 | 1 |
Salem City | 0 | 0 | 0 | 0 | 1 |
Scott County | 0 | 1 | 0 | 0 | 0 |
Shenandoah County | 1 | 0 | 0 | 2 | 2 |
Smyth County | 0 | 0 | 0 | 0 | 0 |
South Boston City (No Longer A County Equivalent) | 0 | 0 | 0 | 0 | 0 |
Southampton County | 2 | 1 | 0 | 0 | 0 |
Spotsylvania County | 4 | 0 | 3 | 4 | 5 |
Stafford County | 1 | 1 | 2 | 2 | 3 |
Staunton City | 0 | 0 | 0 | 0 | 0 |
Suffolk City | 6 | 2 | 1 | 2 | 1 |
Surry County | 0 | 0 | 0 | 1 | 1 |
Sussex County | 0 | 1 | 1 | 5 | 7 |
Tazewell County | 1 | 0 | 3 | 2 | 1 |
Virginia Beach City | 7 | 6 | 2 | 8 | 6 |
Warren County | 0 | 0 | 0 | 1 | 2 |
Washington County | 5 | 1 | 1 | 4 | 0 |
Waynesboro City | 1 | 0 | 0 | 0 | 0 |
Westmoreland County | 0 | 0 | 2 | 0 | 0 |
Williamsburg City | 0 | 0 | 0 | 0 | 0 |
Winchester City | 0 | 0 | 0 | 0 | 0 |
Wise County | 0 | 2 | 0 | 3 | 1 |
Wythe County | 0 | 2 | 1 | 2 | 2 |
York County | 1 | 3 | 0 | 2 | 1 |
Fatalities in Crashes Involving an Alcohol-Impaired Driver (BAC = .08+) by County in Virginia
County Name | 2013 | 2014 | 2015 | 2016 | 2017 |
---|---|---|---|---|---|
Accomack County | 4 | 3 | 1 | 3 | 1 |
Albemarle County | 5 | 5 | 4 | 3 | 6 |
Alexandria City | 1 | 0 | 2 | 1 | 1 |
Alleghany County | 1 | 1 | 2 | 2 | 2 |
Amelia County | 1 | 0 | 1 | 2 | 3 |
Amherst County | 0 | 0 | 1 | 2 | 1 |
Appomattox County | 1 | 0 | 0 | 2 | 0 |
Arlington County | 1 | 2 | 2 | 0 | 1 |
Augusta County | 5 | 3 | 5 | 7 | 4 |
Bath County | 0 | 0 | 0 | 0 | 0 |
Bedford City | 0 | 0 | 0 | 0 | 0 |
Bedford County | 3 | 2 | 4 | 7 | 6 |
Bland County | 1 | 0 | 1 | 0 | 0 |
Botetourt County | 4 | 1 | 2 | 0 | 1 |
Bristol City | 1 | 0 | 0 | 0 | 0 |
Brunswick County | 1 | 4 | 1 | 0 | 0 |
Buchanan County | 4 | 1 | 1 | 2 | 1 |
Buckingham County | 1 | 6 | 2 | 6 | 2 |
Buena Vista City | 0 | 0 | 0 | 0 | 0 |
Campbell County | 1 | 2 | 1 | 6 | 4 |
Caroline County | 4 | 0 | 2 | 3 | 2 |
Carroll County | 2 | 2 | 1 | 1 | 2 |
Charles City County | 0 | 2 | 1 | 2 | 0 |
Charlotte County | 1 | 0 | 1 | 3 | 0 |
Charlottesville City | 0 | 0 | 0 | 1 | 0 |
Chesapeake City | 4 | 2 | 6 | 5 | 6 |
Chesterfield County | 11 | 8 | 8 | 11 | 7 |
Clarke County | 0 | 0 | 1 | 0 | 0 |
Clifton Forge City | 0 | 0 | 0 | 0 | 0 |
Colonial Heights City | 0 | 0 | 1 | 3 | 0 |
Covington City | 0 | 0 | 0 | 0 | 0 |
Craig County | 3 | 0 | 2 | 0 | 0 |
Culpeper County | 4 | 1 | 1 | 2 | 1 |
Cumberland County | 1 | 0 | 0 | 0 | 2 |
Danville City | 1 | 0 | 1 | 0 | 0 |
Dickenson County | 2 | 0 | 0 | 0 | 1 |
Dinwiddie County | 4 | 1 | 2 | 3 | 1 |
Emporia City | 1 | 0 | 0 | 0 | 0 |
Essex County | 0 | 2 | 0 | 2 | 2 |
Fairfax City | 0 | 0 | 0 | 1 | 0 |
Fairfax County | 16 | 10 | 4 | 9 | 11 |
Falls Church City | 0 | 0 | 0 | 0 | 0 |
Fauquier County | 2 | 3 | 4 | 4 | 1 |
Floyd County | 3 | 0 | 1 | 0 | 1 |
Fluvanna County | 4 | 2 | 1 | 0 | 0 |
Franklin City | 0 | 0 | 0 | 0 | 0 |
Franklin County | 1 | 4 | 2 | 1 | 3 |
Frederick County | 4 | 1 | 3 | 1 | 7 |
Fredericksburg City | 0 | 0 | 0 | 1 | 1 |
Galax City | 0 | 0 | 0 | 0 | 0 |
Giles County | 0 | 2 | 0 | 0 | 2 |
Gloucester County | 1 | 1 | 3 | 1 | 3 |
Goochland County | 3 | 2 | 4 | 0 | 2 |
Grayson County | 0 | 1 | 0 | 3 | 0 |
Greene County | 1 | 0 | 0 | 0 | 1 |
Greensville County | 0 | 2 | 0 | 1 | 1 |
Halifax County | 2 | 2 | 3 | 3 | 2 |
Hampton City | 4 | 5 | 3 | 2 | 2 |
Hanover County | 3 | 5 | 5 | 3 | 3 |
Harrisonburg City | 0 | 0 | 0 | 0 | 0 |
Henrico County | 10 | 8 | 4 | 7 | 4 |
Henry County | 5 | 2 | 4 | 3 | 3 |
Highland County | 0 | 1 | 0 | 0 | 0 |
Hopewell City | 1 | 0 | 1 | 0 | 0 |
Isle Of Wight County | 3 | 3 | 1 | 2 | 2 |
James City County | 3 | 2 | 2 | 1 | 9 |
King And Queen County | 1 | 0 | 0 | 0 | 2 |
King George County | 1 | 3 | 1 | 4 | 1 |
King William County | 1 | 0 | 0 | 1 | 1 |
Lancaster County | 2 | 1 | 0 | 2 | 1 |
Lee County | 3 | 0 | 2 | 2 | 0 |
Lexington City | 0 | 0 | 0 | 0 | 0 |
Loudoun County | 4 | 4 | 4 | 2 | 11 |
Louisa County | 7 | 1 | 1 | 6 | 4 |
Lunenburg County | 2 | 1 | 1 | 0 | 3 |
Lynchburg City | 0 | 0 | 1 | 0 | 1 |
Madison County | 0 | 0 | 1 | 1 | 0 |
Manassas City | 0 | 0 | 0 | 0 | 0 |
Manassas Park City | 0 | 0 | 0 | 0 | 0 |
Martinsville City | 0 | 0 | 0 | 0 | 0 |
Mathews County | 1 | 0 | 0 | 0 | 0 |
Mecklenburg County | 3 | 0 | 0 | 4 | 4 |
Middlesex County | 1 | 1 | 1 | 0 | 0 |
Montgomery County | 3 | 2 | 2 | 0 | 4 |
Nelson County | 0 | 1 | 3 | 0 | 1 |
New Kent County | 2 | 2 | 2 | 1 | 0 |
Newport News City | 4 | 3 | 6 | 5 | 5 |
Norfolk City | 9 | 10 | 5 | 3 | 6 |
Northampton County | 0 | 0 | 1 | 0 | 0 |
Northumberland County | 1 | 1 | 0 | 1 | 0 |
Norton City | 0 | 0 | 0 | 0 | 0 |
Nottoway County | 1 | 1 | 1 | 1 | 0 |
Orange County | 5 | 1 | 2 | 2 | 3 |
Page County | 0 | 1 | 1 | 1 | 1 |
Patrick County | 3 | 0 | 2 | 0 | 1 |
Petersburg City | 1 | 2 | 0 | 3 | 0 |
Pittsylvania County | 5 | 4 | 7 | 6 | 6 |
Poquoson City | 0 | 0 | 1 | 0 | 0 |
Portsmouth City | 1 | 1 | 1 | 3 | 5 |
Powhatan County | 4 | 1 | 1 | 0 | 1 |
Prince Edward County | 2 | 2 | 2 | 3 | 1 |
Prince George County | 3 | 1 | 3 | 1 | 1 |
Prince William County | 3 | 5 | 1 | 9 | 5 |
Pulaski County | 1 | 3 | 0 | 0 | 3 |
Radford City | 0 | 0 | 0 | 0 | 0 |
Rappahannock County | 0 | 0 | 0 | 0 | 1 |
Richmond City | 5 | 5 | 5 | 6 | 3 |
Richmond County | 0 | 0 | 0 | 1 | 0 |
Roanoke City | 1 | 4 | 4 | 4 | 4 |
Roanoke County | 2 | 1 | 2 | 3 | 2 |
Rockbridge County | 1 | 3 | 2 | 1 | 2 |
Rockingham County | 6 | 6 | 1 | 3 | 4 |
Russell County | 1 | 0 | 3 | 1 | 4 |
Salem City | 0 | 0 | 0 | 0 | 0 |
Scott County | 0 | 1 | 1 | 2 | 0 |
Shenandoah County | 1 | 0 | 1 | 0 | 0 |
Smyth County | 0 | 1 | 2 | 0 | 1 |
South Boston City (No Longer A County Equivalent) | 0 | 0 | 0 | 0 | 0 |
Southampton County | 1 | 4 | 2 | 0 | 1 |
Spotsylvania County | 2 | 6 | 3 | 5 | 8 |
Stafford County | 4 | 1 | 3 | 1 | 4 |
Staunton City | 0 | 0 | 0 | 0 | 0 |
Suffolk City | 4 | 4 | 3 | 0 | 3 |
Surry County | 0 | 0 | 1 | 1 | 0 |
Sussex County | 0 | 2 | 0 | 1 | 6 |
Tazewell County | 1 | 1 | 2 | 1 | 0 |
Virginia Beach City | 11 | 13 | 7 | 4 | 8 |
Warren County | 3 | 3 | 2 | 2 | 1 |
Washington County | 2 | 1 | 1 | 1 | 0 |
Waynesboro City | 1 | 0 | 0 | 0 | 0 |
Westmoreland County | 0 | 0 | 2 | 0 | 1 |
Williamsburg City | 0 | 0 | 0 | 0 | 0 |
Winchester City | 0 | 0 | 0 | 0 | 0 |
Wise County | 2 | 2 | 0 | 1 | 0 |
Wythe County | 0 | 1 | 5 | 1 | 2 |
York County | 2 | 4 | 1 | 2 | 1 |
Teen Drinking and Driving in Virginia
Virginia has a zero-tolerance policy for teen drunk driving and if you’re caught with a BAC level of more than 0.02 percent while driving, your driving privileges would be suspended for one year and you would be charged a fine of $500.
The under 21 impaired driving fatality rate per 100,000 people in Virginia is 1.1 while the national average is 1.2.
EMS Response Time in Virginia
Type of Road | Time of Crash to EMS Notification | EMS Notification to EMS Arrival | EMS Arrival at Scene to Hospital Arrival | Time of Crash to Hospital Arrival | Total Fatal Crashes |
---|---|---|---|---|---|
Rural | 5.85 | 12.93 | 42.30 | 58.92 | 476 |
Urban | 9.61 | 10.00 | 32.54 | 41.38 | 306 |
Transportation in Virginia
Driving experience in any state is influenced by a couple of factors, for instance, how many cars are owned by households, what is the commute time, and the preferred mode of transportation.
Car Ownership in Virginia
Most of the households own two cars in Virginia as illustrated in this graph by Data USA. Even the national average for ownership is two cars per household (in grey).
Commute Time in Virginia
Unfortunately, the commute time for employees in Virginia is 27 minutes which is higher than the national average of 25.5 minutes.
Commuter Transportation in Virginia
There’s a strong preference for driving alone to work among the people of Virginia much like the rest of the country.
Traffic Congestion in Virginia
Virginia Beach is the 48th most congested city in America and obviously the worst in Virginia as per the traffic analytics firm TomTom.
You can also see specific traffic data from Virginia Beach.
- Congestion Level: 12 percent (Highways) and 19 percent (Non-Highways)
- Extra Travel Time in Peak Hours: +6 min (Morning) and +11 min (Evening) per 30 minutes of travel time
- Workdays Peak Congestion: 21 percent (Morning Peak) and 36 percent (Evening Peak)
That was quite a journey taking you through the smallest detail about car insurance and laws in Virginia.
You can start comparison shopping now using our FREE online tool. Enter your zip code below to get started.