15 Worst U.S. Counties for Drunk Driving (2026 Report)
Explore the 15 worst U.S. counties for drunk driving, with El Paso County, Texas, leading at 48% of traffic deaths involving alcohol. Texas counties dominate the list, revealing alarming trends from 2014 to 2018 and highlighting a pressing need for more effective prevention and enforcement measures.
Read more


Find the Lowest Car Insurance Rates Today
Quote’s drivers have found rates as low as $42/month in the last few days!


Table of Contents
Table of Contents

Insurance and Finance Writer
Laura Gunn is a former teacher who uses her passion for writing and learning to help others make the best decisions regarding finance and insurance. After stepping away from the classroom, Laura used her skills to write across many different industries including insurance, finance, real estate, home improvement, and healthcare. Her experience in various industries has helped develop both her ...
Laura Gunn

Licensed Insurance Agent
Ty Stewart is the founder and CEO of SimpleLifeInsure.com. He started researching and studying about insurance when he got his first policy for his own family. He has been featured as an insurance expert speaker at agent conventions and in top publications. As an independent licensed insurance agent, he has helped clients nationwide to secure affordable coverage while making the process simpl...
Ty Stewart
Updated January 2025
The Broader Consequences of Drunk Driving
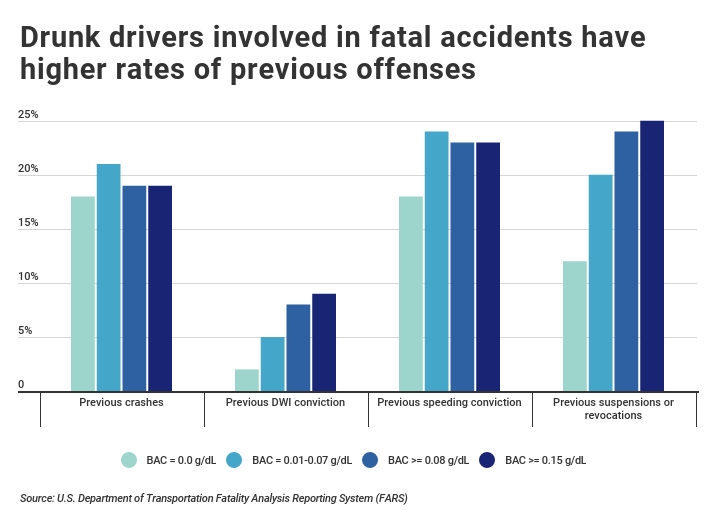
Drunk drivers are not the only ones affected by the decision to drive while impaired. In fact, in 2018, only 61 percent of the alcohol-related traffic fatalities were the drunk drivers themselves.
Over the past five years, Texas accounted for 13.8 percent of all drunk-driving fatalities in the U.S., despite accounting for only 8.8 percent of the population.
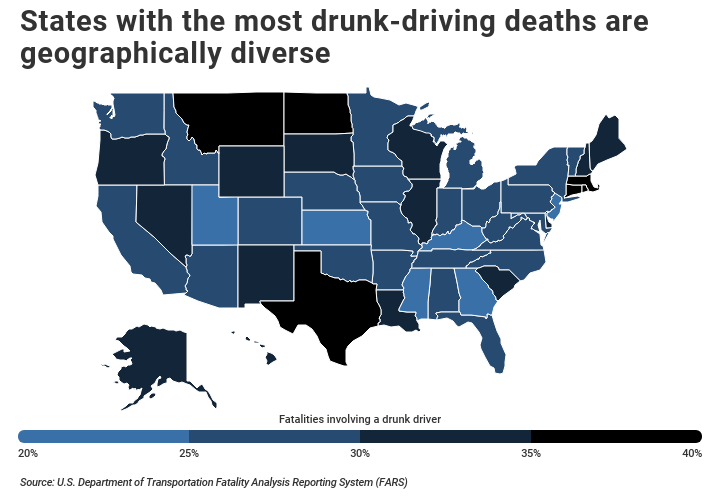
While drunk driving is a nationwide problem, some individual states struggle more than others. For example, in Texas, 40 percent of traffic deaths involve an impaired driver; nationally, that number is 29 percent.
Other states that are known for having high proportions of alcohol-related fatalities include Connecticut and North Dakota, both at 39 percent. At a more granular level, some individual counties also have significantly above-average alcohol-related traffic fatality rates.
Drunk driving is a public safety crisis. With nearly 40% of traffic fatalities in some states involving alcohol, the danger extends far beyond the impaired driver, affecting passengers, pedestrians, and children.
Brad Larson Licensed Insurance Agent
To find which U.S. counties have the highest percentage of traffic fatalities involving a drunk driver, our researchers at AutoInsuranceEZ.com analyzed 2014-2018 data from the National Highway Traffic Safety Administration’s Fatality Analysis Reporting System.
Counties were ranked according to the percentage of fatalities between 2014 and 2018 that involved at least one driver having a blood-alcohol level exceeding 0.08 mg/dL, a level that is illegal in all 50 U.S. states. In the event of a tie, the county with the higher per capita rate of alcohol-related fatalities was ranked higher.
To improve relevance, our researchers grouped counties into cohorts based on population: large counties (750,000 or more), midsize counties (350,000-749,999), and small counties (200,000-349,999). Among the 15 large counties with the most drunk-driving deaths, 10 are located in Texas.
Texas is also disproportionately represented among small and midsize counties as well. Here are the counties with the largest share of traffic fatalities involving drunk drivers.
Data here: https://docs.google.com/spreadsheets/d/1JROR78-5lM7J-x0R8-c6p_4Xri0zFcQxkpE9G8mbkFo/edit#gid=0
| Small Counties | Share | Midsize Counties | Share | |
|---|---|---|---|---|
| 1. Lubbock County, TX | 49% | 1. Douglas County, NE | 43% | |
| 2. Hays County, TX | 48% | 2. Brazoria County, TX | 42% | |
| 3. Galveston County, TX | 47% | 3. Cameron County, TX | 42% | |
| 4. New London County, CT | 44% | 4. Williamson County, TX | 41% | |
| 5. Oneida County, NY | 42% | 5. Hampden County, MA | 41% | |
| 6. Barnstable County, MA | 42% | 6. Nueces County, TX | 40% | |
| 7. Rockingham County, NH | 41% | 7. Bell County, TX | 40% | |
| 8. Lake County, OH | 41% | 8. Plymouth County, MA | 40% | |
| 9. Brown County, WI | 40% | 9. Loudoun County, VA | 40% | |
| 10. Lexington County, SC | 39% | 10. Montgomery County, TX | 38% | |
| 11. Caddo Parish, LA | 39% | 11. Bristol County, MA | 38% | |
| 12. St. Clair County, IL | 39% | 12. Norfolk County, MA | 38% | |
| 13. Saratoga County, NY | 39% | 13. Richland County, SC | 37% | |
| 14. Jackson County, OR | 38% | 14. Montgomery County, OH | 37% | |
| 15. Smith County, TX | 37% | 15. Clackamas County, OR | 37% |
If you live in an area with multiple DUI fatalities, such as the state with the most DUIs or cities with the most DUIs, your insurance rates may be higher. However, shopping around can help you find lower rates despite these risks.
If you’re ready to jump in and get a quote, just plug your ZIP code into our online quote comparison tool. It’ll give you the best rates for you and your area.
In addition, you can check out our auto insurance coverage types page to see which coverages you might want in your auto insurance policy. If you live in an area where there are a large number of drunk driving fatal crashes, your rates might increase even though you have nothing to do with those crashes.
https://twitter.com/AutoInsurance/status/1668418685596504064
Read more: Car Insurance After A DUI
In this article, we use numerous drunk driving facts to create our ranking. They include the highest DUI rates by county and general drunk driving statistics. In the frequently asked questions section, we’ll get into drunk driving arrests by state per capita and the worst states for drunk driving.
Large Counties With the Worst Drunk-Driving Problem
Now, let’s get started with our list of the counties that have the worst drunk-driving problems.
#15 – Fairfield County, Connecticut
- Share of total driving fatalities involving a drunk driver: 38%
- Drunk-driving fatality rate: 2.1 per 100k
- Total drunk-driving fatalities (last 5 years): 99
- Total traffic fatalities (last 5 years): 259
#14 – Worcester County, Massachusetts
- Share of total driving fatalities involving a drunk driver: 38%
- Drunk-driving fatality rate: 2.5 per 100k
- Total drunk-driving fatalities (last 5 years): 104
- Total traffic fatalities (last 5 years): 272
RELATED
Similar to getting a DUI, if you were convicted of reckless driving, your insurance rates will likely skyrocket. A reckless driving offense can increase insurance costs for many years.
#13 – Hartford County, Connecticut
- Share of total driving fatalities involving a drunk driver: 38%
- Drunk-driving fatality rate: 2.64 per 100k
- Total drunk-driving fatalities (last 5 years): 118
- Total traffic fatalities (last 5 years): 309
#12 – Fort Bend County, Texas
- Share of total driving fatalities involving a drunk driver: 39%
- Drunk-driving fatality rate: 1.78 per 100k
- Total drunk-driving fatalities (last 5 years): 70
- Total traffic fatalities (last 5 years): 181
#11 – Cuyahoga County, Ohio
- Share of total driving fatalities involving a drunk driver: 39%
- Drunk-driving fatality rate: 2.23 per 100k
- Total drunk-driving fatalities (last 5 years): 139
- Total traffic fatalities (last 5 years): 361
Enter your ZIP code below to compare auto insurance rates.
#10 – New Haven County, Connecticut
- Share of total driving fatalities involving a drunk driver: 39%
- Drunk-driving fatality rate: 3.31 per 100k
- Total drunk-driving fatalities (last 5 years): 142
- Total traffic fatalities (last 5 years): 361
#9 – Denton County, Texas
- Share of total driving fatalities involving a drunk driver: 40%
- Drunk-driving fatality rate: 2.1 per 100k
- Total drunk-driving fatalities (last 5 years): 90
- Total traffic fatalities (last 5 years): 225
#8 – Dallas County, Texas
- Share of total driving fatalities involving a drunk driver: 40%
- Drunk-driving fatality rate: 4.26 per 100k
- Total drunk-driving fatalities (last 5 years): 562
- Total traffic fatalities (last 5 years): 1,389
TRENDING
No matter what your situation is, we can help you find the right insurance policy for you. We’ve got you covered whether you are looking for teenager auto insurance, auto insurance for seniors, or single-parent auto insurance.
#7 – Collin County, Texas
- Share of total driving fatalities involving a drunk driver: 42%
- Drunk-driving fatality rate: 2.07 per 100k
- Total drunk-driving fatalities (last 5 years): 104
- Total traffic fatalities (last 5 years): 247
#6 – Bexar County, Texas
- Share of total driving fatalities involving a drunk driver: 42%
- Drunk-driving fatality rate: 4.03 per 100k
- Total drunk-driving fatalities (last 5 years): 400
- Total traffic fatalities (last 5 years): 944
#5 – Tarrant County, Texas
- Share of total driving fatalities involving a drunk driver: 45%
- Drunk-driving fatality rate: 3.56 per 100k
- Total drunk-driving fatalities (last 5 years): 371
- Total traffic fatalities (last 5 years): 821
RELATED
Drunk driving is often seen as a nighttime issue, with people leaving bars or happy hours and driving home without sobering up. However, day drinking can also pose significant risks, especially during high-traffic periods.
Rush-hour fatal crashes due to drunk driving are not uncommon, particularly in the worst cities for drunk driving and the worst cities for rush-hour fatalities, where the likelihood of the worst drunk driving accidents increases during these times.
Are DUIs common in these areas? The answer is yes, especially during high-traffic periods.
#4 – Travis County, Texas
- Share of total driving fatalities involving a drunk driver: 45%
- Drunk-driving fatality rate: 4.29 per 100k
- Total drunk-driving fatalities (last 5 years): 268
- Total traffic fatalities (last 5 years): 598
#3 – Harris County, Texas
- Share of total driving fatalities involving a drunk driver: 46%
- Drunk-driving fatality rate: 4.1 per 100k
- Total drunk-driving fatalities (last 5 years): 964
- Total traffic fatalities (last 5 years): 2,102
#2 – Hidalgo County, Texas
- Share of total driving fatalities involving a drunk driver: 47%
- Drunk-driving fatality rate: 3.46 per 100k
- Total drunk-driving fatalities (last 5 years): 150
- Total traffic fatalities (last 5 years): 318
DID YOU KNOW?
Finding auto insurance with a bad driving record doesn’t have to cost a fortune. Keep in mind that very few people have a perfect driving record.
#1 – El Paso County, Texas
- Share of total driving fatalities involving a drunk driver: 48%
- Drunk-driving fatality rate: 4.02 per 100k
- Total drunk-driving fatalities (last 5 years): 169
- Total traffic fatalities (last 5 years): 354
All Counties Ranked by Drunk-Driving Problem
When it comes to the impact of drunk driving, not all areas are affected equally. Below, we rank counties across the country based on their drunk-driving issues, shedding light on the regions where this dangerous behavior is most prevalent.
Data here: https://docs.google.com/spreadsheets/d/1AUDH4HvAL3mMxRiOWNZFOB60WAIeMuK9G7-PLFKWMuY/edit#gid=0
| County | Fatalities Involving Drunk Driver | Fatality Rate (per 100k) | Drunk-Driving Fatalities | Traffic Fatalities | Population (2018) |
|---|---|---|---|---|---|
| Lubbock County, TX | 49% | 6.1 | 94 | 191 | 307,412 |
| El Paso County, TX | 48% | 20.1 | 169 | 354 | 840,758 |
| Hays County, TX | 48% | 5.6 | 62 | 129 | 222,631 |
| Hidalgo County, TX | 47% | 17.3 | 150 | 318 | 865,939 |
| Galveston County, TX | 47% | 5.7 | 96 | 204 | 337,890 |
| Harris County, TX | 46% | 20.5 | 964 | 2,102 | 4,698,619 |
| Travis County, TX | 45% | 21.5 | 268 | 598 | 1,248,743 |
| Tarrant County, TX | 45% | 17.8 | 371 | 821 | 2,084,931 |
| New London County, CT | 44% | 4.6 | 62 | 139 | 266,784 |
| Douglas County, NE | 43% | 16.1 | 91 | 210 | 566,880 |
| Brazoria County, TX | 42% | 22.2 | 82 | 195 | 370,200 |
| Bexar County, TX | 42% | 20.1 | 400 | 944 | 1,986,049 |
| Cameron County, TX | 42% | 16.5 | 70 | 167 | 423,908 |
| Collin County, TX | 42% | 10.3 | 104 | 247 | 1,005,146 |
| Oneida County, NY | 42% | 3.2 | 37 | 88 | 229,577 |
| Barnstable County, MA | 42% | 3.0 | 32 | 76 | 213,413 |
| Williamson County, TX | 41% | 15.7 | 89 | 216 | 566,719 |
| Hampden County, MA | 41% | 15.1 | 71 | 176 | 470,406 |
| Rockingham County, NH | 41% | 3.2 | 49 | 120 | 309,176 |
| Lake County, OH | 41% | 2.0 | 23 | 57 | 230,514 |
| Nueces County, TX | 40% | 23.7 | 86 | 214 | 362,265 |
| Bell County, TX | 40% | 23.1 | 82 | 203 | 355,642 |
| Dallas County, TX | 40% | 21.3 | 562 | 1,389 | 2,637,772 |
| Plymouth County, MA | 40% | 15.6 | 81 | 204 | 518,132 |
| Denton County, TX | 40% | 10.5 | 90 | 225 | 859,064 |
| Loudoun County, VA | 40% | 6.6 | 27 | 67 | 406,850 |
| Brown County, WI | 40% | 2.6 | 34 | 85 | 263,378 |
| New Haven County, CT | 39% | 16.6 | 142 | 361 | 857,620 |
| Fort Bend County, TX | 39% | 8.9 | 70 | 181 | 787,858 |
| Lexington County, SC | 39% | 6.3 | 93 | 239 | 295,032 |
| Caddo Parish, LA | 39% | 6.0 | 73 | 188 | 242,922 |
| St. Clair County, IL | 39% | 5.2 | 68 | 176 | 261,059 |
| Saratoga County, NY | 39% | 2.8 | 32 | 80 | 230,163 |
| Montgomery County, TX | 38% | 18.6 | 110 | 291 | 590,925 |
| Bristol County, MA | 38% | 14.0 | 79 | 208 | 564,022 |
| Hartford County, CT | 38% | 13.2 | 118 | 309 | 892,697 |
| Worcester County, MA | 38% | 12.5 | 104 | 272 | 830,839 |
| Cuyahoga County, OH | 38% | 11.2 | 139 | 361 | 1,243,857 |
| Fairfield County, CT | 38% | 10.5 | 99 | 259 | 943,823 |
| Norfolk County, MA | 38% | 9.6 | 68 | 180 | 705,388 |
| Jackson County, OR | 38% | 4.6 | 51 | 133 | 219,564 |
| Richland County, SC | 37% | 23.2 | 96 | 257 | 414,576 |
| Montgomery County, OH | 37% | 17.5 | 93 | 254 | 532,331 |
| Clackamas County, OR | 37% | 15.9 | 66 | 178 | 416,075 |
| Smith County, TX | 37% | 8.5 | 98 | 266 | 230,221 |
| McLennan County, TX | 37% | 5.1 | 65 | 174 | 254,607 |
| Brazos County, TX | 37% | 3.3 | 37 | 99 | 226,758 |
| Washoe County, NV | 36% | 16.3 | 76 | 209 | 465,735 |
| El Paso County, CO | 36% | 15.4 | 110 | 307 | 713,856 |
| Chester County, PA | 36% | 11.9 | 62 | 174 | 522,046 |
| Dane County, WI | 36% | 11.2 | 61 | 170 | 542,364 |
| Calcasieu Parish, LA | 36% | 6.3 | 64 | 180 | 203,112 |
| Butte County, CA | 36% | 5.3 | 61 | 168 | 231,256 |
| Luzerne County, PA | 36% | 3.5 | 56 | 156 | 317,646 |
| Marion County, OR | 36% | 3.3 | 58 | 161 | 346,868 |
| York County, ME | 36% | 3.3 | 34 | 95 | 206,229 |
| Richmond city, VA | 36% | 2.3 | 26 | 74 | 228,783 |
| Prince George's County, MD | 35% | 18.1 | 165 | 466 | 909,308 |
| Mecklenburg County, NC | 35% | 15.5 | 170 | 481 | 1,093,901 |
| Summit County, OH | 35% | 11.6 | 63 | 179 | 541,918 |
| Polk County, IA | 35% | 8.6 | 42 | 120 | 487,204 |
| District of Columbia, DC | 35% | 6.7 | 47 | 135 | 702,455 |
| Westchester County, NY | 35% | 6.3 | 61 | 175 | 967,612 |
| Berkeley County, SC | 35% | 5.6 | 62 | 178 | 221,091 |
| Washington County, PA | 35% | 4.4 | 46 | 130 | 207,346 |
| Winnebago County, IL | 35% | 3.5 | 50 | 142 | 284,081 |
| Benton County, WA | 35% | 2.5 | 25 | 73 | 201,877 |
| Charleston County, SC | 34% | 25.4 | 103 | 303 | 405,905 |
| Stanislaus County, CA | 34% | 21.3 | 117 | 349 | 549,815 |
| Orleans Parish, LA | 34% | 21.2 | 83 | 241 | 391,006 |
| Denver County, CO | 34% | 12.1 | 87 | 257 | 716,492 |
| Hamilton County, OH | 34% | 11.5 | 94 | 274 | 816,684 |
| Spokane County, WA | 34% | 11.3 | 58 | 169 | 514,631 |
| Lake County, IL | 34% | 9.8 | 69 | 203 | 700,832 |
| Providence County, RI | 34% | 8.8 | 56 | 166 | 636,084 |
| Jefferson County, TX | 34% | 4.7 | 60 | 175 | 255,001 |
| Madison County, IL | 34% | 4.3 | 57 | 166 | 264,461 |
| Leon County, FL | 34% | 3.8 | 56 | 166 | 292,502 |
| Webb County, TX | 34% | 3.6 | 50 | 146 | 275,910 |
| Lackawanna County, PA | 34% | 3.4 | 36 | 106 | 210,793 |
| Durham County, NC | 34% | 2.9 | 46 | 135 | 316,739 |
| Westmoreland County, PA | 33% | 17.1 | 60 | 180 | 350,611 |
| Sonoma County, CA | 33% | 13.8 | 69 | 211 | 499,942 |
| Franklin County, OH | 33% | 10.8 | 141 | 431 | 1,310,300 |
| Multnomah County, OR | 33% | 9.5 | 77 | 232 | 811,880 |
| Virginia Beach city, VA | 33% | 9.3 | 42 | 126 | 450,189 |
| Honolulu County, HI | 33% | 9.1 | 89 | 271 | 980,080 |
| Allegheny County, PA | 33% | 8.7 | 106 | 320 | 1,218,452 |
| Cook County, IL | 33% | 8.3 | 431 | 1,294 | 5,180,493 |
| Yakima County, WA | 33% | 4.5 | 56 | 169 | 251,446 |
| San Luis Obispo County, CA | 33% | 3.9 | 56 | 172 | 284,010 |
| York County, SC | 33% | 3.4 | 47 | 142 | 274,118 |
| Jackson County, MO | 32% | 19.6 | 137 | 431 | 700,307 |
| Bernalillo County, NM | 32% | 19.4 | 132 | 416 | 678,701 |
| Forsyth County, NC | 32% | 17.4 | 66 | 203 | 379,099 |
| Davidson County, TN | 32% | 17.0 | 118 | 365 | 692,587 |
| Lucas County, OH | 32% | 14.7 | 63 | 194 | 429,899 |
| Jefferson County, CO | 32% | 12.2 | 71 | 224 | 580,233 |
| Wake County, NC | 32% | 9.5 | 104 | 328 | 1,092,305 |
| Clark County, WA | 32% | 9.1 | 44 | 140 | 481,857 |
| Passaic County, NJ | 32% | 7.6 | 38 | 117 | 503,310 |
| Suffolk County, MA | 32% | 5.5 | 44 | 135 | 807,252 |
| Middlesex County, MA | 32% | 4.6 | 75 | 239 | 1,614,714 |
| Lafayette Parish, LA | 32% | 3.2 | 39 | 120 | 242,782 |
| McHenry County, IL | 32% | 2.5 | 38 | 119 | 308,570 |
| Dutchess County, NY | 32% | 2.5 | 36 | 113 | 293,718 |
| Chesterfield County, VA | 32% | 2.4 | 42 | 134 | 348,556 |
| Duval County, FL | 31% | 23.0 | 219 | 703 | 950,181 |
| Greenville County, SC | 31% | 22.6 | 116 | 373 | 514,213 |
| Riverside County, CA | 31% | 17.7 | 434 | 1,382 | 2,450,758 |
| Guilford County, NC | 31% | 17.4 | 93 | 299 | 533,670 |
| Madison County, AL | 31% | 15.6 | 57 | 181 | 366,519 |
| Suffolk County, NY | 31% | 14.2 | 211 | 684 | 1,481,093 |
| Allen County, IN | 31% | 14.1 | 53 | 173 | 375,351 |
| Milwaukee County, WI | 31% | 12.4 | 118 | 375 | 948,201 |
| Will County, IL | 31% | 12.3 | 85 | 274 | 692,310 |
| Butler County, OH | 31% | 11.5 | 44 | 142 | 382,378 |
| Ventura County, CA | 31% | 9.4 | 80 | 257 | 850,967 |
| Contra Costa County, CA | 31% | 9.2 | 106 | 341 | 1,150,215 |
| Waukesha County, WI | 31% | 8.7 | 35 | 112 | 403,072 |
| King County, WA | 31% | 7.1 | 159 | 519 | 2,233,163 |
| Spartanburg County, SC | 31% | 5.8 | 91 | 291 | 313,888 |
| Sussex County, DE | 31% | 5.2 | 60 | 192 | 229,286 |
| St. Louis city, MO | 31% | 5.2 | 79 | 259 | 302,838 |
| Yuma County, AZ | 31% | 3.6 | 38 | 124 | 212,128 |
| St. Joseph County, IN | 31% | 2.6 | 35 | 112 | 270,771 |
| Norfolk city, VA | 31% | 2.3 | 28 | 89 | 244,076 |
| Albany County, NY | 31% | 2.1 | 32 | 105 | 307,117 |
| Marin County, CA | 31% | 1.4 | 18 | 58 | 259,666 |
| Mobile County, AL | 30% | 27.3 | 113 | 375 | 413,757 |
| Tulare County, CA | 30% | 24.0 | 112 | 371 | 465,861 |
| Pulaski County, AR | 30% | 20.6 | 81 | 266 | 392,680 |
| San Bernardino County, CA | 30% | 20.1 | 437 | 1,461 | 2,171,603 |
| Jefferson County, AL | 30% | 19.3 | 127 | 421 | 659,300 |
| Lee County, FL | 30% | 19.2 | 145 | 488 | 754,610 |
| Lane County, OR | 30% | 17.9 | 68 | 228 | 379,611 |
| Monterey County, CA | 30% | 16.3 | 71 | 239 | 435,594 |
| Lake County, IN | 30% | 16.1 | 78 | 259 | 484,411 |
| New Castle County, DE | 30% | 15.4 | 86 | 288 | 559,335 |
| Solano County, CA | 30% | 14.6 | 65 | 220 | 446,610 |
| York County, PA | 30% | 14.3 | 64 | 211 | 448,273 |
| Sacramento County, CA | 30% | 14.3 | 220 | 728 | 1,540,975 |
| Clark County, NV | 30% | 13.8 | 307 | 1,029 | 2,231,647 |
| Stark County, OH | 30% | 13.7 | 51 | 167 | 371,574 |
| Orange County, NY | 30% | 12.8 | 49 | 161 | 381,951 |
| Anne Arundel County, MD | 30% | 11.3 | 65 | 216 | 576,031 |
| Gwinnett County, GA | 30% | 10.1 | 94 | 311 | 927,781 |
| Pierce County, WA | 30% | 10.1 | 90 | 303 | 891,299 |
| Jefferson Parish, LA | 30% | 9.7 | 42 | 140 | 434,051 |
| Arapahoe County, CO | 30% | 9.4 | 61 | 205 | 651,215 |
| Anderson County, SC | 30% | 6.6 | 66 | 222 | 200,482 |
| Horry County, SC | 30% | 6.2 | 106 | 347 | 344,147 |
| Tuscaloosa County, AL | 30% | 5.6 | 59 | 193 | 208,911 |
| Okaloosa County, FL | 30% | 4.1 | 42 | 143 | 207,269 |
| Cumberland County, NC | 30% | 3.9 | 64 | 215 | 332,330 |
| Washington County, AR | 30% | 3.0 | 36 | 117 | 236,961 |
| Cabarrus County, NC | 30% | 2.8 | 30 | 99 | 211,342 |
| Cumberland County, PA | 30% | 2.7 | 34 | 114 | 251,423 |
| Lorain County, OH | 30% | 2.6 | 41 | 136 | 309,461 |
| New Hanover County, NC | 30% | 2.3 | 27 | 90 | 232,274 |
| Arlington County, VA | 30% | 0.5 | 6 | 21 | 237,521 |
| Kern County, CA | 29% | 23.3 | 209 | 727 | 896,764 |
| San Joaquin County, CA | 29% | 20.2 | 152 | 528 | 752,660 |
| Shelby County, TN | 29% | 19.6 | 183 | 637 | 935,764 |
| East Baton Rouge Parish, LA | 29% | 18.1 | 80 | 280 | 440,956 |
| Pinellas County, FL | 29% | 17.6 | 172 | 596 | 975,280 |
| Sarasota County, FL | 29% | 17.3 | 74 | 257 | 426,718 |
| DeKalb County, GA | 29% | 16.0 | 121 | 421 | 756,558 |
| Oklahoma County, OK | 29% | 15.3 | 121 | 421 | 792,582 |
| Tulsa County, OK | 29% | 15.1 | 98 | 337 | 648,360 |
| Adams County, CO | 29% | 14.3 | 73 | 251 | 511,868 |
| Bucks County, PA | 29% | 11.9 | 75 | 257 | 628,195 |
| Santa Barbara County, CA | 29% | 11.0 | 49 | 167 | 446,527 |
| San Diego County, CA | 29% | 10.6 | 354 | 1,217 | 3,343,364 |
| Onondaga County, NY | 29% | 9.5 | 44 | 152 | 461,809 |
| Hillsborough County, NH | 29% | 8.7 | 36 | 125 | 415,247 |
| Monroe County, NY | 29% | 8.2 | 61 | 210 | 742,474 |
| Kane County, IL | 29% | 8.0 | 43 | 147 | 534,216 |
| Erie County, NY | 29% | 7.2 | 66 | 228 | 919,719 |
| Delaware County, PA | 29% | 6.2 | 35 | 120 | 564,751 |
| Ramsey County, MN | 29% | 4.2 | 23 | 81 | 550,210 |
| Bronx County, NY | 29% | 4.0 | 57 | 200 | 1,432,132 |
| Yolo County, CA | 29% | 3.4 | 38 | 130 | 220,408 |
| Clay County, FL | 29% | 3.1 | 34 | 117 | 216,072 |
| Fayette County, KY | 29% | 3.1 | 50 | 172 | 323,780 |
| Union County, NC | 29% | 2.8 | 33 | 113 | 235,908 |
| Mahoning County, OH | 29% | 2.5 | 29 | 99 | 229,642 |
| Benton County, AR | 29% | 2.2 | 30 | 101 | 272,608 |
| Chesapeake city, VA | 29% | 2.1 | 25 | 84 | 242,634 |
| Ingham County, MI | 29% | 2.0 | 30 | 104 | 292,735 |
| Thurston County, WA | 29% | 1.9 | 27 | 91 | 286,419 |
| Volusia County, FL | 28% | 27.0 | 148 | 531 | 547,538 |
| Osceola County, FL | 28% | 20.4 | 75 | 269 | 367,990 |
| Pinal County, AZ | 28% | 19.0 | 85 | 304 | 447,138 |
| Orange County, FL | 28% | 16.7 | 230 | 821 | 1,380,645 |
| Wayne County, MI | 28% | 14.0 | 246 | 890 | 1,753,893 |
| Genesee County, MI | 28% | 13.8 | 56 | 197 | 406,892 |
| St. Charles County, MO | 28% | 11.0 | 44 | 154 | 399,182 |
| St. Louis County, MO | 28% | 10.0 | 100 | 363 | 996,945 |
| Ada County, ID | 28% | 7.4 | 35 | 123 | 469,966 |
| Union County, NJ | 28% | 7.3 | 41 | 146 | 558,067 |
| Merced County, CA | 28% | 5.9 | 81 | 288 | 274,765 |
| Washington County, OR | 28% | 5.7 | 34 | 122 | 597,695 |
| Queens County, NY | 28% | 4.4 | 101 | 353 | 2,278,906 |
| Montgomery County, AL | 28% | 4.1 | 46 | 163 | 225,763 |
| St. Lucie County, FL | 28% | 3.4 | 54 | 191 | 321,128 |
| Northampton County, PA | 28% | 2.5 | 38 | 133 | 304,807 |
| Clermont County, OH | 28% | 2.4 | 25 | 88 | 205,466 |
| Delaware County, OH | 28% | 2.1 | 21 | 77 | 204,826 |
| Henrico County, VA | 28% | 1.8 | 30 | 109 | 329,261 |
| Marion County, FL | 27% | 27.8 | 100 | 369 | 359,977 |
| Manatee County, FL | 27% | 20.5 | 81 | 305 | 394,855 |
| Hillsborough County, FL | 27% | 17.7 | 255 | 943 | 1,436,888 |
| Fresno County, CA | 27% | 17.4 | 173 | 642 | 994,400 |
| Knox County, TN | 27% | 17.0 | 79 | 296 | 465,289 |
| Hamilton County, TN | 27% | 14.3 | 52 | 193 | 364,286 |
| Fulton County, GA | 27% | 14.2 | 149 | 556 | 1,050,114 |
| Pima County, AZ | 27% | 14.1 | 146 | 531 | 1,039,073 |
| Marion County, IN | 27% | 13.9 | 133 | 495 | 954,670 |
| Maricopa County, AZ | 27% | 13.2 | 584 | 2,202 | 4,410,824 |
| Lehigh County, PA | 27% | 11.4 | 42 | 156 | 368,100 |
| Seminole County, FL | 27% | 11.3 | 53 | 199 | 467,832 |
| Baltimore County, MD | 27% | 11.2 | 93 | 345 | 828,431 |
| Los Angeles County, CA | 27% | 9.6 | 966 | 3,548 | 10,105,518 |
| Cobb County, GA | 27% | 9.4 | 71 | 267 | 756,865 |
| Orange County, CA | 27% | 8.0 | 255 | 946 | 3,185,968 |
| Nassau County, NY | 27% | 7.9 | 107 | 394 | 1,358,343 |
| Prince William County, VA | 27% | 6.2 | 29 | 110 | 468,011 |
| Essex County, MA | 27% | 5.1 | 40 | 148 | 790,638 |
| Escambia County, FL | 27% | 4.4 | 70 | 255 | 315,534 |
| Fairfax County, VA | 27% | 4.3 | 49 | 179 | 1,150,795 |
| Baldwin County, AL | 27% | 3.9 | 43 | 156 | 218,022 |
| Montgomery County, TN | 27% | 3.7 | 38 | 138 | 205,950 |
| Hawaii County, HI | 27% | 3.6 | 36 | 133 | 200,983 |
| Chatham County, GA | 27% | 3.5 | 51 | 190 | 289,195 |
| Canyon County, ID | 27% | 2.9 | 32 | 121 | 223,499 |
| Clay County, MO | 27% | 2.3 | 28 | 104 | 246,365 |
| Santa Cruz County, CA | 27% | 2.0 | 27 | 98 | 274,255 |
| Lancaster County, NE | 27% | 1.6 | 26 | 95 | 317,272 |
| Polk County, FL | 26% | 21.9 | 155 | 597 | 708,009 |
| Lake County, FL | 26% | 19.9 | 71 | 268 | 356,495 |
| Brevard County, FL | 26% | 18.1 | 108 | 413 | 596,849 |
| Palm Beach County, FL | 26% | 15.0 | 223 | 842 | 1,485,941 |
| Berks County, PA | 26% | 12.1 | 51 | 196 | 420,152 |
| Washtenaw County, MI | 26% | 10.5 | 39 | 149 | 370,963 |
| Monmouth County, NJ | 26% | 9.2 | 57 | 216 | 621,354 |
| Philadelphia County, PA | 26% | 8.1 | 129 | 489 | 1,584,138 |
| Santa Clara County, CA | 26% | 7.8 | 152 | 581 | 1,937,570 |
| Oakland County, MI | 26% | 6.9 | 87 | 333 | 1,259,201 |
| Johnson County, KS | 26% | 5.9 | 35 | 131 | 597,555 |
| Mohave County, AZ | 26% | 5.3 | 56 | 217 | 209,550 |
| Montgomery County, MD | 26% | 4.7 | 49 | 192 | 1,052,567 |
| Hinds County, MS | 26% | 4.6 | 54 | 206 | 237,085 |
| Hennepin County, MN | 26% | 4.4 | 56 | 214 | 1,259,428 |
| Alachua County, FL | 26% | 4.2 | 57 | 219 | 269,956 |
| Johnston County, NC | 26% | 4.1 | 42 | 163 | 202,675 |
| Buncombe County, NC | 26% | 3.1 | 40 | 156 | 259,103 |
| Doña Ana County, NM | 26% | 2.6 | 28 | 105 | 217,522 |
| Erie County, PA | 26% | 2.6 | 35 | 136 | 272,061 |
| Anchorage Municipality, AK | 26% | 2.1 | 30 | 114 | 291,538 |
| Cumberland County, ME | 26% | 1.8 | 26 | 97 | 293,557 |
| Washington County, MN | 26% | 0.9 | 12 | 45 | 259,201 |
| Sedgwick County, KS | 25% | 14.2 | 73 | 286 | 513,607 |
| Collier County, FL | 25% | 12.4 | 47 | 187 | 378,488 |
| Salt Lake County, UT | 25% | 7.6 | 88 | 347 | 1,152,633 |
| Alameda County, CA | 25% | 6.4 | 107 | 426 | 1,666,753 |
| Weld County, CO | 25% | 4.7 | 74 | 294 | 314,305 |
| Jefferson County, MO | 25% | 3.7 | 42 | 168 | 224,347 |
| St. Johns County, FL | 25% | 3.6 | 46 | 182 | 254,261 |
| Gaston County, NC | 25% | 3.5 | 39 | 155 | 222,846 |
| Dauphin County, PA | 25% | 2.7 | 37 | 144 | 277,097 |
| Cleveland County, OK | 25% | 1.8 | 26 | 102 | 281,669 |
| Somerset County, NJ | 25% | 1.7 | 28 | 112 | 331,164 |
| Whatcom County, WA | 25% | 1.7 | 19 | 75 | 225,685 |
| Williamson County, TN | 25% | 1.6 | 19 | 75 | 231,729 |
| Hamilton County, IN | 25% | 1.1 | 18 | 73 | 330,086 |
| Pasco County, FL | 24% | 19.5 | 105 | 433 | 539,630 |
| Jefferson County, KY | 24% | 13.9 | 107 | 445 | 770,517 |
| Broward County, FL | 24% | 13.8 | 270 | 1,105 | 1,951,260 |
| Miami-Dade County, FL | 24% | 12.9 | 355 | 1,491 | 2,761,581 |
| Larimer County, CO | 24% | 12.0 | 42 | 173 | 350,518 |
| Kent County, MI | 24% | 11.5 | 75 | 310 | 653,786 |
| Lancaster County, PA | 24% | 10.9 | 59 | 241 | 543,557 |
| Camden County, NJ | 24% | 9.5 | 48 | 201 | 507,078 |
| Placer County, CA | 24% | 8.1 | 32 | 132 | 393,149 |
| Macomb County, MI | 24% | 7.2 | 63 | 265 | 874,759 |
| Anoka County, MN | 24% | 6.2 | 22 | 92 | 353,813 |
| DuPage County, IL | 24% | 4.5 | 42 | 173 | 928,589 |
| Richmond County, NY | 24% | 4.0 | 19 | 78 | 476,179 |
| Richmond County, GA | 24% | 3.1 | 31 | 126 | 201,554 |
| Kings County, NY | 24% | 2.9 | 76 | 312 | 2,582,830 |
| Henry County, GA | 24% | 2.8 | 32 | 132 | 230,220 |
| Shelby County, AL | 24% | 2.6 | 28 | 116 | 215,707 |
| Champaign County, IL | 24% | 2.0 | 21 | 88 | 209,983 |
| Ottawa County, MI | 24% | 1.9 | 27 | 113 | 290,494 |
| Baltimore city, MD | 23% | 7.8 | 47 | 203 | 602,495 |
| Snohomish County, WA | 23% | 6.1 | 50 | 217 | 814,901 |
| Essex County, NJ | 23% | 6.0 | 48 | 211 | 799,767 |
| Montgomery County, PA | 23% | 5.6 | 46 | 197 | 828,604 |
| Hall County, GA | 23% | 3.2 | 32 | 140 | 202,148 |
| Clayton County, GA | 23% | 2.8 | 40 | 172 | 289,615 |
| St. Tammany Parish, LA | 23% | 2.3 | 30 | 130 | 258,111 |
| Niagara County, NY | 23% | 1.8 | 19 | 82 | 210,433 |
| Boulder County, CO | 23% | 1.6 | 26 | 111 | 326,078 |
| Rockland County, NY | 23% | 1.0 | 16 | 71 | 325,695 |
| Harrison County, MS | 22% | 3.1 | 32 | 143 | 206,650 |
| Atlantic County, NJ | 22% | 2.9 | 39 | 175 | 265,429 |
| Rutherford County, TN | 22% | 2.5 | 40 | 178 | 324,890 |
| Kalamazoo County, MI | 22% | 2.4 | 32 | 146 | 264,870 |
| Harford County, MD | 22% | 1.7 | 22 | 98 | 253,956 |
| Kitsap County, WA | 22% | 1.5 | 20 | 90 | 269,805 |
| Warren County, OH | 22% | 1.4 | 16 | 74 | 232,173 |
| Howard County, MD | 22% | 1.3 | 21 | 94 | 323,196 |
| Douglas County, CO | 22% | 1.2 | 20 | 89 | 342,776 |
| Burlington County, NJ | 21% | 10.3 | 46 | 221 | 445,384 |
| Mercer County, NJ | 21% | 6.8 | 25 | 121 | 369,811 |
| Middlesex County, NJ | 21% | 5.5 | 46 | 218 | 829,685 |
| San Mateo County, CA | 21% | 4.5 | 35 | 171 | 769,545 |
| Hudson County, NJ | 21% | 3.8 | 26 | 124 | 676,061 |
| Davis County, UT | 20% | 4.5 | 16 | 79 | 351,713 |
| San Francisco County, CA | 20% | 3.6 | 32 | 156 | 883,305 |
| Bergen County, NJ | 20% | 3.5 | 33 | 163 | 936,692 |
| Elkhart County, IN | 20% | 2.2 | 23 | 113 | 205,560 |
| New York County, NY | 20% | 2.2 | 36 | 180 | 1,628,701 |
| Gloucester County, NJ | 20% | 2.2 | 32 | 162 | 291,408 |
| Linn County, IA | 20% | 1.2 | 13 | 68 | 225,909 |
| Yavapai County, AZ | 19% | 3.9 | 45 | 229 | 231,993 |
| Dakota County, MN | 19% | 3.5 | 15 | 77 | 425,423 |
| Forsyth County, GA | 19% | 1.0 | 12 | 66 | 236,612 |
| Greene County, MO | 18% | 2.0 | 29 | 158 | 291,923 |
| Frederick County, MD | 17% | 1.3 | 17 | 98 | 255,648 |
| Ocean County, NJ | 16% | 5.7 | 34 | 216 | 601,651 |
| Utah County, UT | 15% | 3.9 | 24 | 160 | 622,213 |
| Cherokee County, GA | 14% | 0.9 | 12 | 81 | 254,149 |
| Morris County, NJ | 13% | 3.0 | 15 | 115 | 494,228 |
| Weber County, UT | 11% | 0.8 | 10 | 90 | 256,359 |
By identifying these high-risk counties, we can better understand the scope of the drunk-driving problem and work towards creating safer communities for everyone
Methodology: Finding the Worst Counties for Drunk Driving
Fatality statistics were obtained from the National Highway Traffic Safety Administration’s Fatality Analysis Reporting System for the period 2014 to 2018. County population statistics were obtained from the U.S. Census Bureau’s American Community Survey. Only counties with a population of 750,000 or more were considered in the analysis.
Fatalities per 100k residents were calculated as the sum of fatalities for 2014-2018 divided by the sum of the populations for the same years, multiplied by 100,000.
Counties were ranked according to the percentage of fatalities that involved at least one driver having a blood-alcohol level exceeding 0.08 mg/dL, a level that is illegal in all 50 U.S. states. In the event of a tie, the county with the higher per capita rate of alcohol-related fatalities was ranked higher.
Aside from the tragic loss of life, drunk driving imposes a significant economic burden. The NHTSA estimates that the cost of alcohol-impaired crashes in the United States was $44 billion in 2010, including expenses related to property damage, medical care, and legal fees.
Understanding how these accidents change your car insurance rate can help you manage the financial consequences effectively. These costs include property damage, medical expenses, legal fees, and more.
The NHTSA further estimates that the total value of “societal harm” (such as loss of quality of life) from alcohol-related traffic crashes for that same year would be $201.1 billion.
Many states are introducing new laws and technologies to keep drunk drivers off the road and to prevent their status of being among the worst states for drunk driving accidents.
For example, several states have created zero-tolerance laws for drivers under the age of 21. To cut down on repeat offenses, some states are also using ignition interlocks for drivers who have already been convicted of drunk driving.
Ignition interlocks require drivers to take a breathalyzer test to measure BAC before driving a vehicle, and the vehicle will not start if the breathalyzer detects alcohol. According to the CDC, ignition interlocks can reduce repeat offenses for DWI by 70 percent.
Drunk driving isn’t limited to those behind the wheel. In El Paso County, where 48% of traffic fatalities involve alcohol, the impact stretches to passengers, pedestrians, and even children.
Melanie Musson Published Insurance Expert
Furthermore, 37 states and the District of Columbia have implemented sobriety checkpoints, which are often used on highways during major holiday weekends like the Fourth of July or New Year’s Eve, when drinking is common and the likelihood of drunk driving is greater.
A combination of legislative action to discourage drunk driving, as well as greater public awareness of the dangers of drunk driving, suggests that alcohol-related fatality rates could decline in the years ahead.
If you live in an area with a high number of drunk driving deaths, your insurance rates could rise, even if you’ve never been a part of those accidents. Fortunately, there are ways to lower your rates. Enter your ZIP code into our online quote generator to find the best rates for your area based on your demographic information and driving history.
Frequently Asked Questions
What country has the most DUIs?
The United States has one of the highest DUI rates globally, with millions of arrests annually.
Can I go to Mexico with a DUI?
Entry into Mexico may be denied if you have a DUI on your record, depending on the severity and when it occurred.
What state has the most DUI deaths?
North Dakota has the most DUI deaths per capita, making it one of the worst states for drunk driving fatalities.
Which county in the US has the highest DUI fatality rate in the country?
Wondering what county has the highest DUI rate? According to our study of the highest DUI rates by county, El Paso County, Texas, has the highest DUI fatality rate in the country with 48% of traffic deaths involving a drunk driver.
What city has the highest DUI rate?
Where are the most DUIs in America? Cheyenne, Wisconsin, holds the title of the DUI capital of the United States, with DUI rates nearly triple the national average. According to statistics on DUI, smaller cities or towns often report higher arrest rates for DUIs, as indicated by FBI data.
What state has the highest rate of drunk driving?
Based on our calculations of DUI conviction rates by state, which integrate FBI DUI arrest data with Census population statistics, North Dakota emerges as the state with the highest rate of drunk driving arrests, with 633 DUI arrests per 100,000 residents. This makes it one of the states with the highest DUI rates.
What’s the most dangerous holiday?
The most dangerous holiday can vary each year, but it typically falls on one of three major holidays: Independence Day, Memorial Day, or Labor Day. These holidays consistently see the highest number of traffic deaths, often due to drunk driving, especially in the worst DUI states.
How many times will a person drive drunk before being caught?
On average, a person will drive under the influence 80 times before their first DUI arrest. This statistic highlights the challenge even in states with the strictest DUI laws, such as North Dakota, which are among the worst drunk driving states.
How many lives are lost due to drunk driving?
According to the National Highway Traffic Safety Administration, over 10,000 people die in traffic accidents involving a drunk driver every year.
What is the most dangerous day to drive?
Saturday is consistently the most dangerous day to drive, with more people on the road after the workweek, and Saturday night is still considered a night to party, which adds to the number of drunk driving traffic deaths.
How can you spot a drunk driver?
What state is most lenient on DUI?
What county in the US has the most DUIs?
Which country has the highest rate of drunk driving?
Which city has the most drunk driving accidents?
What country has the strictest DUI laws?
What city has the safest drivers?
What age are the most drunk drivers?
Which state is the strictest on alcohol?
What city in the US has the lowest alcohol consumption?
What state has the most drunk driving deaths?
Which city in the US has the most accidents?
Which country has the most relaxed drunk driving laws?
What is the deadliest holiday for drunk driving?
What age are most DUIs?
What gender has the most DUIs?
Related Articles
-
Jan 2025

Will my auto insurance cover international rentals? (2026 Coverage Details)
-
Nov 2024
Self-Driving Cars: Are Self-Driving Cars Safe?
-
Nov 2024
Auto Insurance Coverage: What events are and are not covered by your policy?
-
Jan 2025
Is it bad to get multiple auto insurance quotes? (+How to Save in 2026)
-
Jan 2025
Will my auto insurance cover other cars? (2026 Coverage Facts)


Get a FREE Quote in Minutes
Insurance rates change constantly — we help you stay ahead by making it easy to compare top options and save.