10 Worst Cities for Rush Hour Fatal Crashes (See Our 2025 Study)
The worst cities for rush hour fatal crashes report higher accident rates during peak travel times, with Seattle leading at 35 percent of fatal crashes occurring during rush hours. These cities experience increased risks due to heavy congestion, and drivers often face higher insurance rates as a result.
Free Auto Insurance Comparison
Compare Quotes From Top Companies and Save
Secured with SHA-256 Encryption
Jeffrey Manola
Licensed Insurance Agent
Jeffrey Manola is an experienced insurance agent who founded TopQuoteLifeInsurance.com and NoMedicalExamQuotes.com. His mission when creating these sites was to provide online consumers searching for insurance with the most affordable rates available. Not only does he strive to provide consumers with the best prices for insurance coverage, but he also wants those on the market for insurance to ...
Licensed Insurance Agent
UPDATED: Jan 28, 2025
It’s all about you. We want to help you make the right coverage choices.
Advertiser Disclosure: We strive to help you make confident insurance decisions. Comparison shopping should be easy. We partner with top insurance providers. This doesn’t influence our content. Our opinions are our own.
Editorial Guidelines: We are a free online resource for anyone interested in learning more about auto insurance. Our goal is to be an objective, third-party resource for everything auto insurance related. We update our site regularly, and all content is reviewed by auto insurance experts.
UPDATED: Jan 28, 2025
It’s all about you. We want to help you make the right coverage choices.
Advertiser Disclosure: We strive to help you make confident insurance decisions. Comparison shopping should be easy. We partner with top insurance providers. This doesn’t influence our content. Our opinions are our own.
On This Page
The worst cities for rush hour fatal crashes report higher accident rates during peak traffic, driven by congestion, reckless driving, and challenging commute times.

Seattle leads with 35 percent of its fatal crashes happening during rush hour, with other cities following closely. These crashes raise safety risks and drive up local auto insurance rates.
Top 10 Worst Cities for Rush Hour Fatal Crashes
Recognizing the rush hour definition helps high-risk drivers navigate busy roads safely and manage insurance costs effectively.
Use our free quote comparison tool below to find the best coverage in your area and see how rates are affected in the worst cities for rush hour fatal crashes.
- Seattle leads the cities for rush hour fatal crashes at 35 percent of accidents
- Congestion increases crash risks and raises insurance rates in major cities
- High-risk drivers in these areas face more accidents and costly premiums
Deadliest Drive Times: Top Cities for Rush Hour Fatalities
Driving is a leading cause of death for people of all ages, especially those under 24. This article explores the ten worst cities for rush hour fatal crashes, highlighting areas where commuting increases the risk for high-risk drivers and deadly accidents. Rush-hour crashes account for 16.7 percent of all fatal accidents.
These incidents vary in severity across different cities, from those notorious for poor driving to those known for safer roads. Additionally, the article will cover daily and annual US fatal crash statistics, offer safety tips for rush-hour driving, and discuss the safest days to drive.
Living in a city with more fatal crashes can result in higher auto insurance rates, even if you’re a safe driver with a good record.
Comparing auto insurance rates can be particularly helpful if an individual finds their current rates to be very high, making it easier for the said person to find coverage that fits within a budget. Also, keep in mind the safety aspects, especially if you reside in one of the US deadliest cities, where rates could be influenced by local risks.
Enter your ZIP code below to compare auto insurance rates.
Secured with SHA-256 Encryption
Rush Hour Fatalities: Trends Across the Deadliest Cities
We’ve covered the ten worst cities for rush hour fatal crashes individually. Now, we’ll take a look at them as a group. The following graphic shows the ten worst cities for rush hour fatal crashes in terms of their fatal crashes occurring during the morning or evening rush hour.
Seattle’s rush hour accounts for over a third of its fatal crashes, showing how congestion and stress turn commutes into dangerous drives.
Ty Stewart Licensed Insurance Agent
As you can see, while there are some slight variances for each city, when totaling all the fatal crashes occurring in the morning rush hour compared to the evening rush hour, they are almost dead even: 60 fatal crashes occurring during the morning rush hour and 61 fatal crashes occurring during the evening rush hour.
Morning vs Evening Rush Hour: Deadliest Driving Times
| City | Rush Hour Fatal Crashes | Fatal Crashes (Morning) | Fatal Crashes (Evening) |
|---|---|---|---|
| Baton Rouge, Louisiana | 10 | 6 | 4 |
| Boise, Idaho | 2 | 0 | 2 |
| New York, New York | 48 | 25 | 23 |
| Pittsburgh, Pennsylvania | 5 | 1 | 4 |
| Portland, Oregon | 9 | 5 | 4 |
| Riverside, California | 7 | 3 | 4 |
| San Francisco, California | 7 | 5 | 2 |
| San Jose, California | 14 | 6 | 8 |
| Seattle, Washington | 8 | 3 | 5 |
| Tampa, Florida | 11 | 6 | 5 |
The most significant differences occur in Pittsburgh and San Francisco, ranked 5th and tied for 6th, respectively. Out of five total fatal crashes in Pittsburgh, four occurred during the evening rush hour. San Francisco was the opposite, with five of its fatal crashes occurring during the morning rush hour and just two during the evening.
All ten deadliest cities had fatal crashes during both morning and evening rush hours, with no more than a two-crash difference. Three cities saw just a one-crash gap between morning and evening fatalities, and some also rank among the cities with the highest vehicle theft rates.
Rush Hour Impact: Analyzing Congestion in America’s Deadliest Cities
The table below, sourced from TomTom, details rush hour traffic congestion in the ten deadliest cities, highlighting them as the worst cities for rush hour fatal crashes. It also includes data on the annual time lost per driver due to this congestion.
Morning vs Evening Rush Hour: Time Lost by City
| City | Time Lost (Morning) | Time Lost (Evening) | Annual Time Lost |
|---|---|---|---|
| Baton Rouge, Louisiana | 11 min | 20 min | 4 days and 23 hours |
| Boise, Idaho | 8 min | 14 min | 3 days and 15 hours |
| New York, New York | 16 min | 21 min | 5 days and 22 hours |
| Pittsburgh, Pennsylvania | 10 min | 13 min | 3 days and 15 hours |
| Portland, Oregon | 11 min | 17 min | 4 days and 16 hours |
| Riverside, California | 12 min | 16 min | 4 days and 14 hours |
| San Francisco, California | 17 min | 21 min | 6 days and 3 hours |
| San Jose, California | 18 min | 23 min | 6 days and 14 hours |
| Seattle, Washington | 16 min | 20 min | 5 days and 18 hours |
| Tampa, Florida | 12 min | 17 min | 4 days and 14 hours |
The ten deadliest cities were consistent in congestion and which rush hour had the most congestion or time lost. During the morning rush hours, drivers spent 13 minutes per trip. During evening rush hours, that number jumped to 18 minutes.
In every city, the commute time for evening rush hours took longer than for morning rush hours.
Baton Rouge saw the largest difference, with 11 minutes of additional time during morning rush hour commutes versus 20 minutes for evening rush hour commutes.
On the other hand, the ten deadliest cities varied considerably regarding the average time lost per year due to traffic congestion during rush hours. The two with the smallest time lost yearly were Boise and Pittsburgh — 87 hours total, or three days and 15 hours. The one with the most significant time lost per year was San Jose, with 158 hours lost per driver, or six days and 14 hours.
Traffic congestion during rush hours in the ten deadliest cities averaged 121 hours—equal to five days and one hour. For driving tips for road safety and a deeper look at how these numbers compare across all sampled cities, keep reading.
All 30 Cities Compared for Rush Hour Fatal Crashes
In our study, we analyzed the 30 most heavily trafficked cities in America as identified by industry leader TomTom. These cities represent a broad geographic range, although some regions are more represented than others. This helps us pinpoint the worst cities for rush hour fatal crashes across different areas.
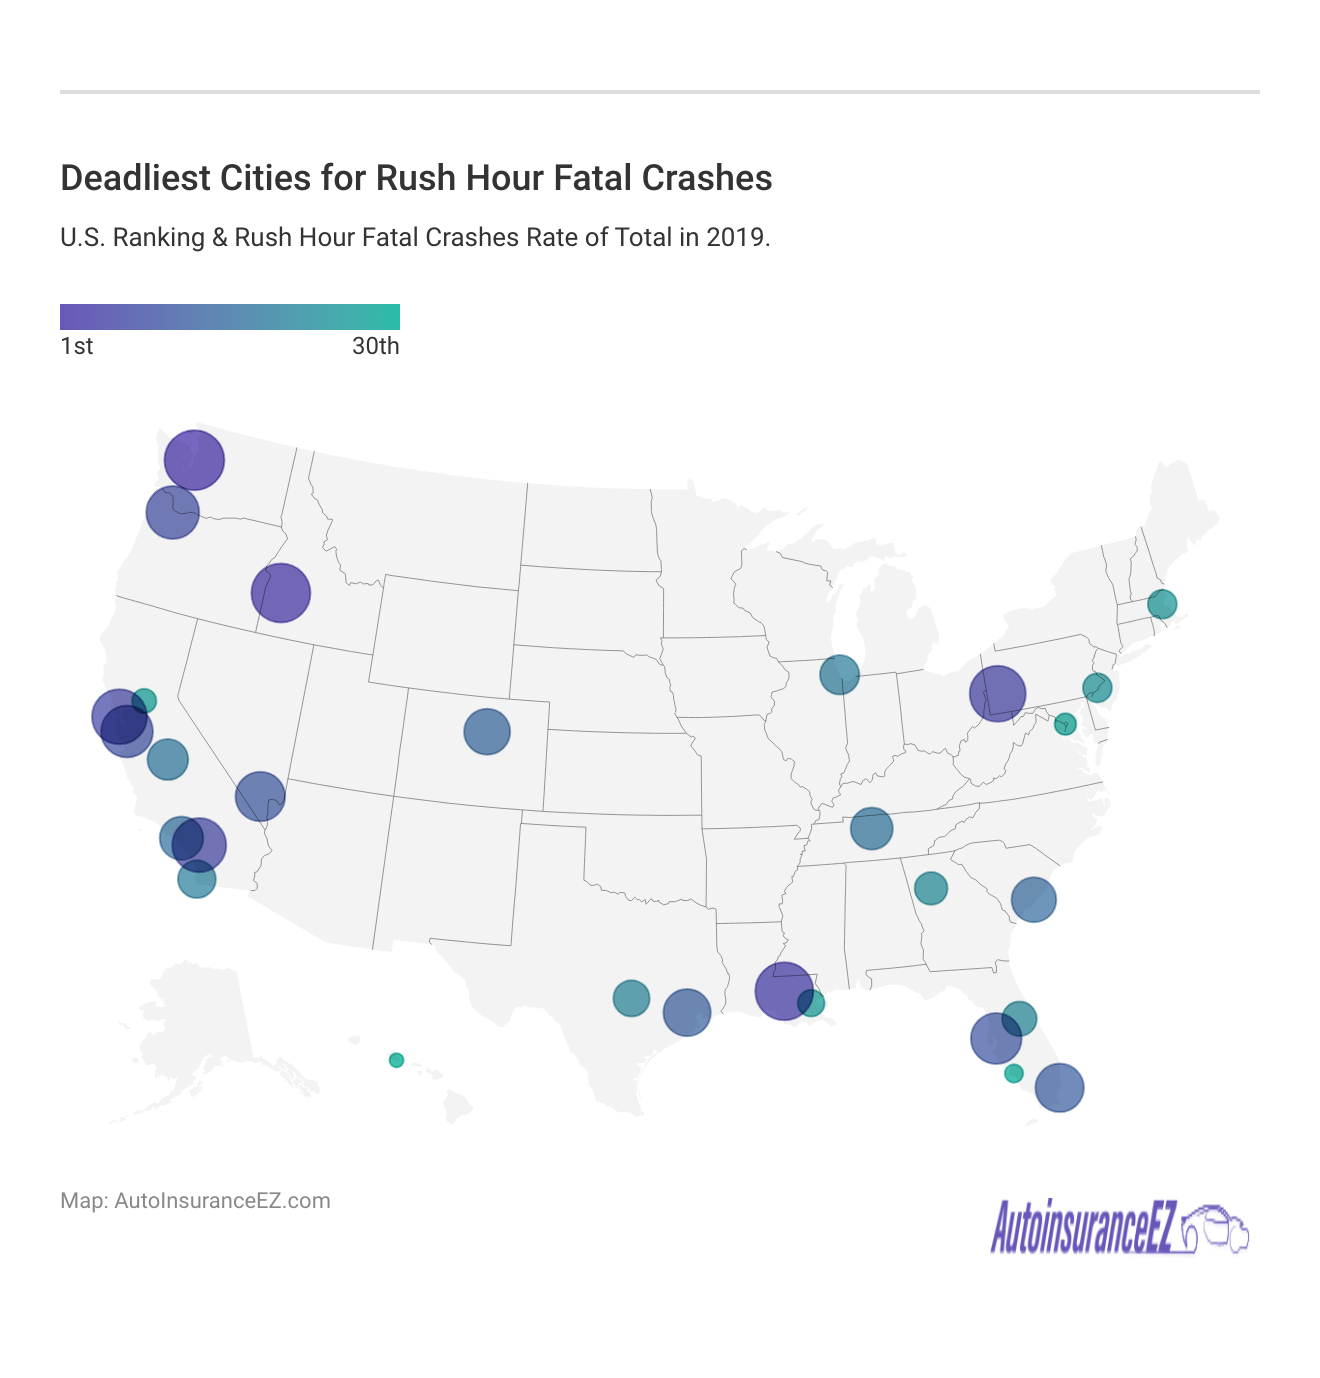
The following graph shows all 30 cities with their corresponding ranking, overall fatal crashes, rush hour fatal crashes, and the percentage of their fatal crashes that occurred during rush hour. The graph is interactive. Hold your cursor over a city if you’re on a laptop or desktop computer to reveal the statistics for an individual city. If you’re on mobile, press your finger down on a city to see the same statistics.
The West and South dominate the list of the ten worst cities for rush hour fatal crashes, with 13 and 12 cities, respectively. The Northeast has four, and the Midwest has one: Chicago. While fatal crash numbers often correlate with population or vehicle counts, the percentage of rush hour crashes doesn’t always match; for instance, Los Angeles, despite many crashes, has a low rush hour percentage.
The gap in fatal rush hour crash rates is significant, with Seattle at 34.8 percent and Cape Coral-Fort Myers, Florida, at 4.4 percent. Honolulu, despite being one of the 30 most trafficked cities, reported no rush hour fatalities. Understanding patterns like these helps drivers stay informed about traffic stop reasons and safety risks in different areas.
Enter your ZIP code below to compare auto insurance rates.
Secured with SHA-256 Encryption
Comparative Analysis of Rush Hour Fatal Crashes Across U.S. Cities
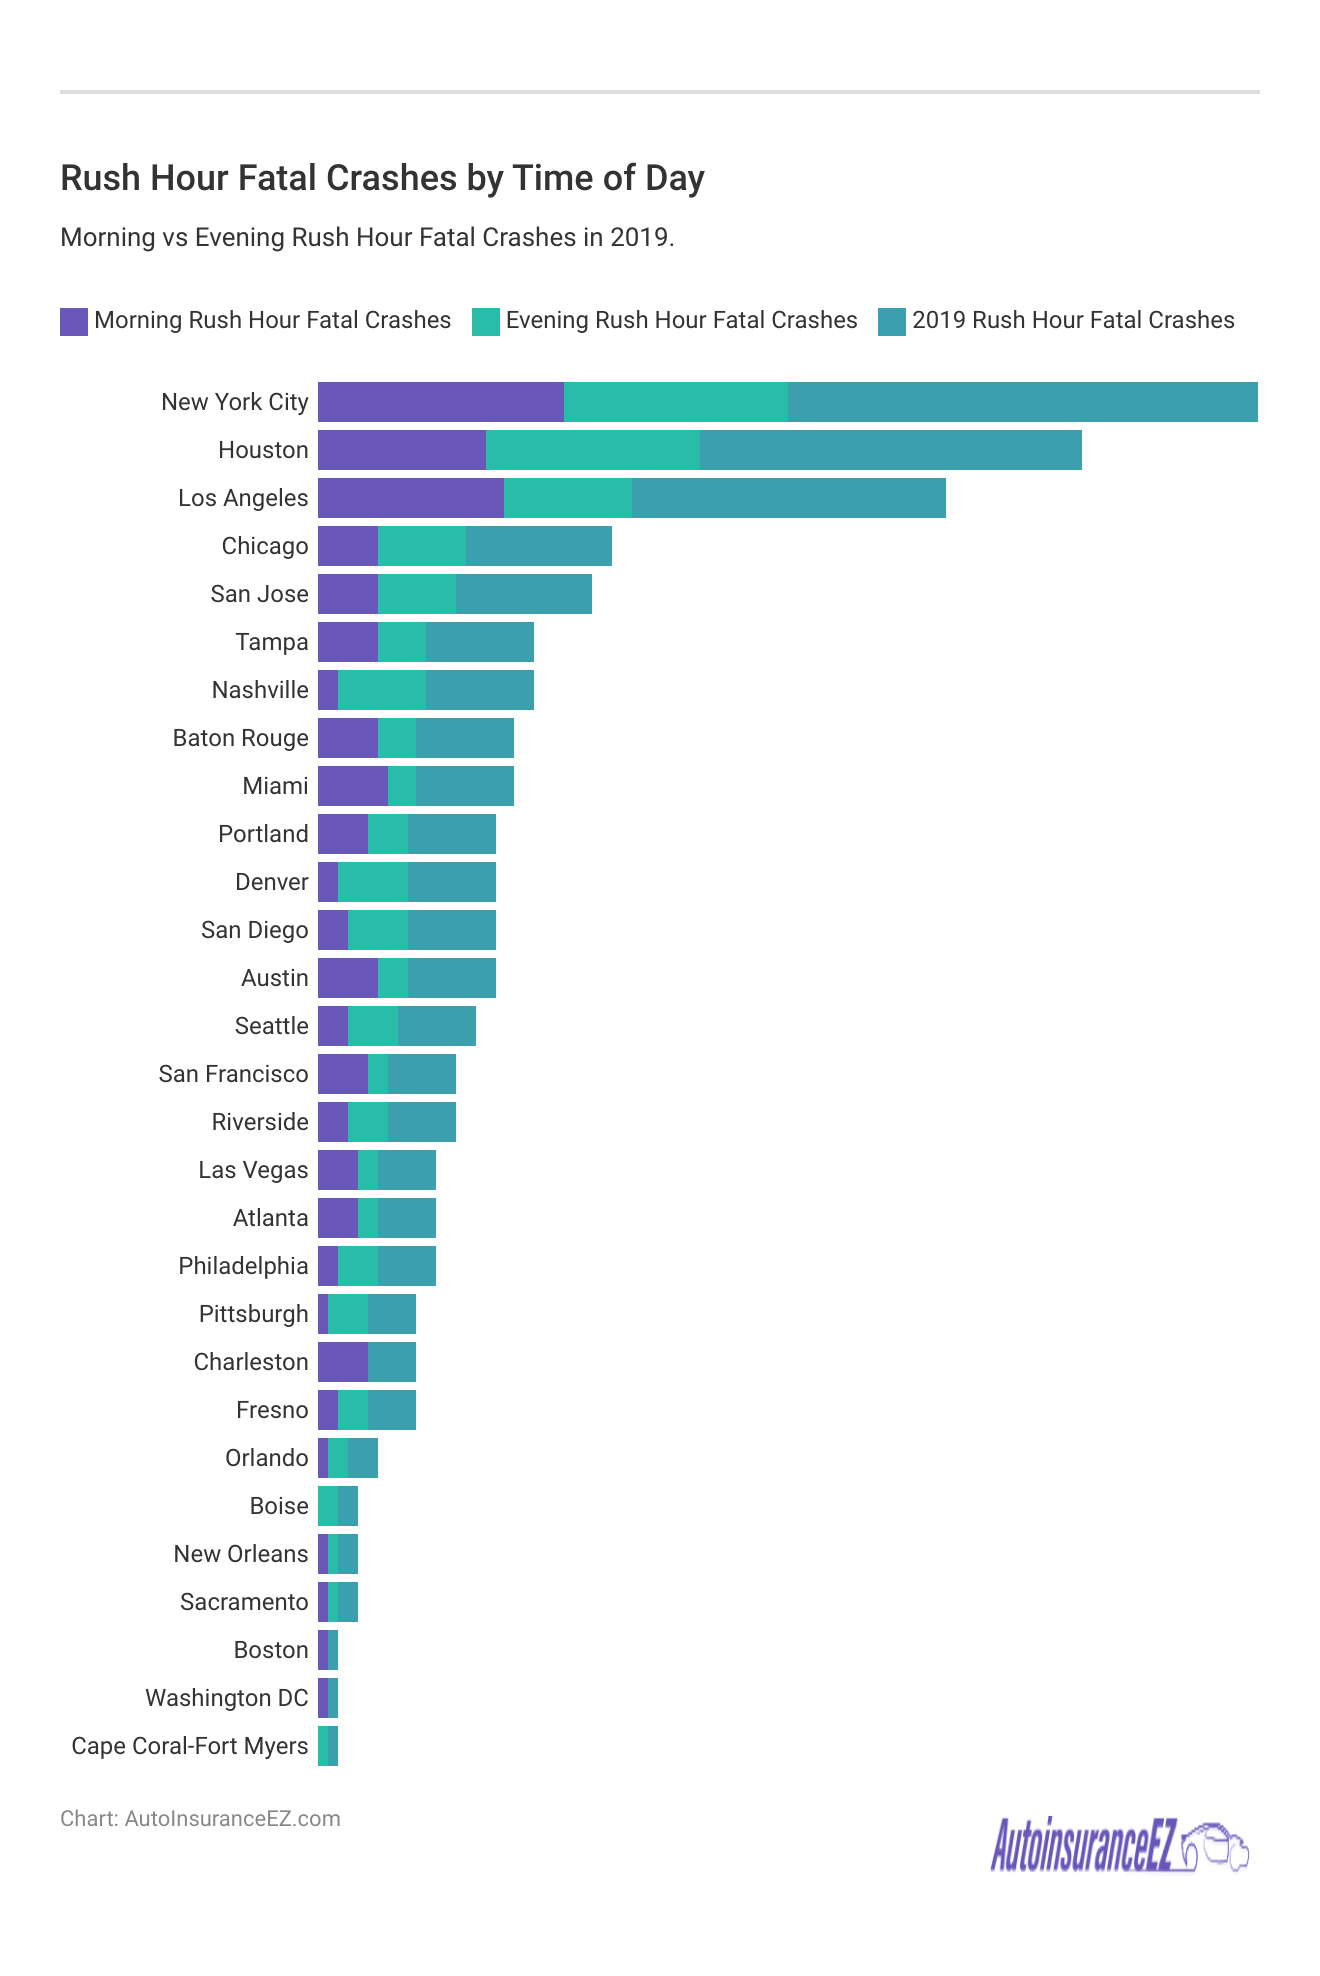
The graph compares morning and evening rush hour fatal crashes across all 30 cities to identify the most dangerous for rush hour crashes. Altogether, the 30 cities in our sample accounted for 293 rush hour fatal crashes. Like the ten worst cities for rush hour fatal crashes, the deadly crashes are split relatively evenly between morning and evening rush hour crashes—144 and 149 fatal crashes.
Nashville shows a stark contrast in fatal crashes with two in the morning versus nine in the evening, highlighting it as a city that might experience crashing during peak times.
Most other cities show similar numbers of fatal crashes between the two rush hour periods—though a single driver crashes a car, which can tragically result in multiple deaths.
Analyzing Commute Delays: Rush Hour Time Loss in Major U.S. Cities
This graph displays the time lost during rush hours for 30 cities and the total time lost. It is interactive; hover over or touch a town to view its specific data. The time lost per rush hour varies widely. Boise and Las Vegas lose the least time during morning rush hours, with commutes extending only eight minutes beyond non-rush hours.
Time Lost to Rush Hour in Major U.S Metro Cities
| City | Time Lost (Morning) | Time Lost (Evening) | Annual Time Lost |
|---|---|---|---|
| Atlanta, Georgia | 11 | 17 | 12 days and 4 hours |
| Austin, Texas | 9 | 15 | 7 days and 4 hours |
| Baltimore, Maryland | 10 | 15 | 8 days and 4 hours |
| Charlotte, North Carolina | 9 | 14 | 8 days and 1 hour |
| Chicago, Illinois | 12 | 18 | 13 days and 4 hours |
| Dallas, Texas | 9 | 13 | 6 days and 5 hours |
| Dallas-Fort Worth, Texas | 11 | 17 | 12 days and 2 hours |
| Denver, Colorado | 8 | 13 | 6 days and 5 hours |
| Houston, Texas | 11 | 17 | 13 days and 6 hours |
| Houston, Texas | 9 | 15 | 5 days and 4 hours |
| Las Vegas, Nevada | 9 | 14 | 7 days and 5 hours |
| Long Beach-Anaheim, California | 12 | 18 | 15 days and 3 hours |
| Miami, Florida | 11 | 17 | 12 days and 6 hours |
| Miami, Florida | 8 | 13 | 5 days and 6 hours |
| Minneapolis, Minnesota | 8 | 13 | 5 days and 6 hours |
| Nashville, Tennessee | 10 | 15 | 9 days and 6 hours |
| Newark-Jersey City, New York | 13 | 19 | 16 days and 4 hours |
| Orlando, Florida | 9 | 13 | 6 days and 2 hours |
| Philadelphia, Pennsylvania | 10 | 16 | 11 days and 5 hours |
| Philadelphia, Pennsylvania | 10 | 16 | 7 days and 2 hours |
| Phoenix, Arizona | 10 | 16 | 11 days and 0 hours |
| Phoenix, Arizona | 9 | 13 | 6 days and 4 hours |
| Pittsburgh, Pennsylvania | 10 | 15 | 8 days and 3 hours |
| Portland, Oregon | 9 | 14 | 7 days and 6 hours |
| Sacramento, California | 9 | 13 | 6 days and 3 hours |
| San Diego, California | 9 | 15 | 7 days and 5 hours |
| San Francisco, California | 11 | 16 | 11 days and 4 hours |
| San Francisco, California | 11 | 16 | 8 days and 5 hours |
| Seattle, Washington | 9 | 13 | 6 days and 6 hours |
| Tampa, Florida | 8 | 12 | 5 days and 5 hours |
Fresno loses the least time for the evening rush hour, with commutes extending 11 minutes. Los Angeles loses the most time, with evening commutes extending 25 minutes beyond ordinary. Evening commutes generally take longer than morning ones, with an average of over 17 minutes additional time compared to nearly 13 minutes.
The city with the most amount of time lost to morning rush hours is Los Angeles, where a driver’s commute takes them an additional 19 minutes compared to a non-rush hour trip.
During rush hour traffic times, the average driver loses 116 hours, which adds up to about four days and 20 hours. Collectively, across 30 cities, this loss totals 3,483 hours, or 145 days and three hours.
Impatience during rush hour can lead drivers to perform risky maneuvers to save time. This increases the danger on interstates and other roads, covering defensive driving and tips for road safety.
Driving Hazards During Rush Hour & Safety Initiatives
This study reveals that in heavily trafficked U.S. cities, the risk of fatal car crashes during rush hour is significantly higher than at other times. While 5 percent of fatal crashes occurred during rush hour in many sample cities, this rate increased dramatically in the ten worst cities, peaking at 34.8 percent in Seattle.
Rush hours create driving hazards and dangers that most other times don’t see with the average percentage of fatal crashes occurring during rush hour for all 30 states being 14.4 percent.
Heavier traffic, congested roadways, and specific commuting times can lead to dangerous driving behaviors like speeding or lane weaving. The issue intensifies in areas where the county has problems with drunk driving. While typically considered a nighttime issue, people often drink in the early afternoon and drive while intoxicated, increasing the likelihood of fatal crashes during afternoon rush hours.
Practicing defensive driving and not rushing to your destination can enhance safety, especially in areas where the county has problems with drunk driving. Significant changes for drivers and auto insurance companies during the pandemic led to reduced driving and partial refunds from insurers.
Although COVID-19 resulted in a substantial decrease in fatal crashes, it is unclear if this decline was consistent throughout the year or primarily during the early months of stay-at-home orders.
Enter your ZIP code below to compare auto insurance rates.
Secured with SHA-256 Encryption
Destructive Driving Behaviors & Rush Hour Traffic Stress
Here are insights from professionals on coping with rush hour traffic and the frustrations of getting to work on time. From a cybersecurity expert in Pakistan to a cosplay writer in Canada and a real estate investor in Los Angeles, these perspectives explore traffic, danger, and stress during rush hour.
“Rush hour in Chicago is worse in summer than winter, despite ice and snow. Evening rush hour is more congested since non-9-to-5 commuters are inactive in the morning, and office workers leave downtown all at once in the evening. Cellphone use remains a significant issue, contributing to accidents despite being illegal, with distracted driving often causing miles of traffic backups.”
Jake McKenzie is a content manager for Auto Accessories Garage.
This family-owned business sells automotive parts and accessories.
“Traffic jams are one of the worst parts of city life, each posing different challenges. In the morning, people are groggy, while afternoon jams often result from accidents or breakdowns.
A traffic jam brings loud horns, smoke, and constant shouting from other drivers. It is by no means the best way to start your day.
In Karachi, temperatures can hit 113°F, making jams unbearable. Drivers grow impatient, with constant honking adding to the stress. Working evening shifts helped me avoid the anxiety of rushing to work, a struggle many face daily.”
Yasir Nawaz, with https://www.purevpn.com/business-vpn, firmly believes in the right to digital privacy.
He researches and writes about the latest developments in AI and cybersecurity.
“I work afternoons, so my commute is challenging, but returning home is easy. My biggest challenge is predicting traffic, and I use Google Maps to plan accordingly. I’ve seen sudden lane changes, tailgating, early merging, and weaving on the highway.
Accidents and road closures can suddenly happen though, and that 30-minute commute can be much longer than expected!
When pressed for time, I may take small risks like speeding at a yellow light or making a U-turn. However, I avoid dangerous behavior, and if conditions are bad or I feel unwell, I opt for public transit instead.”
Roger Senpai is a professional cosplayer and writer at The Senpai Blog.
He spends his time writing on all things cosplay, from budgeting to photography tips.
“It takes an hour to cover 20 miles in Los Angeles, causing stress and frequent road rage due to daily accidents. I leave home at 3:15 a.m. to avoid traffic, but my 60-mile drive home still takes two hours, wearing me down.
There is a lot of cursing, honking on the freeway, and sometimes even fights (which are very common in Los Angeles) during rush hour.
I can’t afford to live nearby, leaving little time for anything after work. I hope for expanded roads, carpool lanes, or toll roads to reduce congestion and accidents.
Alan Macias is a real estate investor at Sell Your House, San Diego.
He enjoys real estate development and helping people out of challenging housing situations.
I’ve had close calls with crashes and witnessed fatal accidents. Always drive safely—no texting or drinking behind the wheel.”
Methodology: Ranking the Worst Cities for Rush Hour Fatal Crashes
This study identified the ten worst American cities for rush hour fatal crashes by analyzing the 30 most trafficked cities. Experts examined total fatal crashes, rush hour fatalities, and the percentage of crashes during rush hours to rank the cities, shedding light on the cities with the most car accidents per capita during these peak times.
Our experts also looked at the average percentage of fatal crashes occurring during rush hour for our 10 deadliest cities as well as all our 30 cities in the sample.
They analyzed morning and evening rush hour fatalities and evaluated traffic congestion, including extra commute times. The study, using data from NHTSA and TomTom, compares these cities in detail. Drivers can use apps to find less congested routes and stay safe. It’s also smart to compare auto insurance to secure the best coverage and savings.
Breaking Down the Risks: Deadliest U.S. Cities for Rush Hour Drivers
Navigating rush hour traffic can be hazardous, especially in cities with a high rate of fatal crashes during peak commute times. The worst cities for rush hour fatal crashes highlight the increased risks associated with congested traffic, emphasizing the importance of safe driving and proper insurance coverage.
With 34.8 percent of fatal crashes happening during rush hour, Seattle highlights the need for alert driving and solid insurance. In high-risk areas, getting multiple auto insurance quotes isn’t bad—it’s smart, helping drivers find better coverage and savings.
Plug your ZIP code into our free online quote generator to see the best auto insurance rates in your area that are personalized for your budget and auto insurance needs.
Frequently Asked Questions
At what speed do most traffic deaths occur?
Higher speeds greatly increase the risk of fatal crashes, with speeding involved in about 25 percent of deadly accidents. At 70 mph, the chance of losing control rises, making severe outcomes far more likely. Risky driving habits, like setting your auto insurance miles too low to cut premiums, can also leave you underinsured. This becomes especially dangerous if an accident happens at high speeds, where damages are often more severe.
What causes the most traffic fatalities?
Traffic deaths in the U.S. often result from preventable actions like impaired driving, speeding, and distractions. Even with strict laws, drinking and driving slows reactions and clouds judgment, while speeding reduces time to respond to sudden hazards.
Everyday distractions—like texting or eating—further increase risks, and bad weather, reckless behavior, or skipping seatbelts only add to the danger. Organizations like the NHTSA continue raising awareness to promote safer driving and reduce fatalities.
How many people die daily in traffic?
In the first six months of 2024, the United States witnessed 18,720 traffic-related deaths, a slight decrease of 3.2 percent from the previous year. This marks a continued trend of reduced fatalities, showing that efforts to make roads safer are paying off. We lose about 103 lives every day to road accidents, which reminds us how crucial ongoing safety measures are.
Which country has the highest traffic deaths?
The Central African Republic struggles with the world’s highest traffic death rate, reporting 37.7 fatalities per 100,000 people. This alarming figure reflects significant issues like inadequate infrastructure and weak law enforcement, making road travel especially dangerous.
Organizations such as the World Health Organization offer crucial insights and strategies to address these challenges and improve road safety. On an individual level, practicing safe driving can prevent accidents and even unlock perks like a safe driver discount insurance, encouraging responsible behavior and making roads safer for everyone.
What is the most dangerous crash to avoid?
Head-on collisions are the most dangerous crashes, resulting in traffic injuries and deaths. While many people think of head-on collisions as when another car crosses over the median or midline onto the other side of traffic, it can also happen in single-vehicle accidents, such as going off the road and running into a pole or a tree.
How many people die in traffic accidents each year?
Although traffic deaths in the U.S. have steadily declined over the years, they still top 30,000 annually and have shown slight increases in recent years. This is a big improvement compared to 1979, when over 50,000 people lost their lives in crashes, and the death rate was three times higher than it is today.
Even with progress, car accidents remain common—happening every 60 seconds, with several fatal crashes occurring each hour, according to the NHTSA.
Can you survive a 70 mph crash?
Driving at 70 mph makes a fatal crash far more likely due to the increased difficulty of maintaining control, the heightened chance of rollovers, and the immense force exerted on the body during impact. At this speed, identifying and reacting to potential hazards becomes challenging, especially on dark rural roads or other areas not designed for high speeds.
The risks increase when drivers don’t anticipate obstacles in time. Knowing how to prepare for an emergency can be essential, as quick decision-making and proper preparedness might help avoid serious accidents in such situations.
What is the most common crash?
Rear-end collisions are the most common type of car accident in the U.S., often happening when drivers follow too closely or fail to react in time to sudden stops. These crashes make up a large share of roadway accidents, causing both injuries and property damage.
While rear-end and angle (T-bone) collisions frequently result in non-fatal injuries, the deadliest crashes tend to be side-impact or head-on collisions, where the force of impact is much greater.
Is rush hour dangerous?
Fatal car accidents are most common during rush hour, when crowded roads make crashes more likely. With so many drivers hurrying to get to work or home, aggressive driving becomes more common, which raises the risk of serious accidents. Fatigue also plays a role, as tired drivers are more prone to errors, making these busy travel times even more dangerous.
What is the most dangerous day of the week to drive?
The most dangerous time to be on the road is Saturday, according to NHTSA data, with higher traffic levels and risky behaviors like speeding and drunk driving contributing to the danger. Fridays and Sundays are also high-risk days, making weekends overall more hazardous for drivers.
In contrast, weekdays like Tuesday and Wednesday are typically the safest for travel, although trends can shift slightly each year. This data aligns with findings from some of the worst U.S. counties for drunk driving, where accidents spike over weekends, reinforcing the importance of cautious driving during these times.
Which drivers cause the most accidents?
The drivers that cause the most accidents, at least the most severe ones, typically break the law in some fashion. Statistics show that drunk driving, speeding, and, lately, distracted driving are causing the most fatal crashes.
How do you avoid rush hour traffic?
One way is to leave to go to work before rush hour. You can also leave later than rush hour or work from home. If none of those options appeals, you can try to find alternate routes to work that don’t use the main roads. Using traffic apps like Waze can find the best and quickest ways to work.
Which gender has more car crashes?
Statistics show that men are involved in more car crashes than women, including severe and fatal accidents. This is often linked to behaviors like speeding, drunk driving, and taking unnecessary risks, which endanger not only themselves but also others on the road.
These risks highlight how critical it is to know what to do when another driver crashes your car, as unexpected accidents can leave you liable or without proper coverage if not handled correctly.
Can you survive a 100 mph car crash?
The odds of surviving a crash at 100 mph are very low, and statistics have shown that even with crashes around 75 mph, the odds of surviving drop sharply. Part of the reason is that these crashes result in the most dangerous outcome: the rollover.
What time does rush hour traffic stop?
It stops at different times in different cities, but generally, traffic decreases after 6 pm, and by 7 pm, the roads can be much more straightforward. However, this is dependent on the city in question. For instance, rush hour in Los Angeles, the city with the worst traffic in the United States, can last more than an hour.
Compare insurance rates today by entering your ZIP code into our free comparison tool below.
Enter your ZIP code below to compare auto insurance rates.
Secured with SHA-256 Encryption
Jeffrey Manola
Licensed Insurance Agent
Jeffrey Manola is an experienced insurance agent who founded TopQuoteLifeInsurance.com and NoMedicalExamQuotes.com. His mission when creating these sites was to provide online consumers searching for insurance with the most affordable rates available. Not only does he strive to provide consumers with the best prices for insurance coverage, but he also wants those on the market for insurance to ...
Licensed Insurance Agent
Editorial Guidelines: We are a free online resource for anyone interested in learning more about auto insurance. Our goal is to be an objective, third-party resource for everything auto insurance related. We update our site regularly, and all content is reviewed by auto insurance experts.


