15 Cities With the Highest Vehicle Theft Rates [3-Year Study: 2026 Update]
Explore the 15 cities with the highest vehicle theft rates, where monthly rates for coverage can exceed $200 due to the increased risk. In these high-risk areas, the highest theft vehicles are frequently targeted, driving up insurance premiums and making coverage more expensive.
Read more


Find the Lowest Car Insurance Rates Today
Quote’s drivers have found rates as low as $42/month in the last few days!


Table of Contents
Table of Contents

Published Insurance Expert
Melanie Musson is the fourth generation in her family to work in the insurance industry. She grew up with insurance talk as part of her everyday conversation and has studied to gain an in-depth knowledge of state-specific car insurance laws and dynamics as well as a broad understanding of how insurance fits into every person’s life, from budgets to coverage levels. She also specializes in sustai...
Melanie Musson

Licensed Insurance Agent
Jeff is a well-known speaker and expert in insurance and financial planning. He has spoken at top insurance conferences around the U.S., including the InsuranceNewsNet Super Conference, the 8% Nation Insurance Wealth Conference, and the Digital Life Insurance Agent Mastermind. He has been featured and quoted in Nerdwallet, Bloomberg, Forbes, U.S. News & Money, USA Today, and other leading fina...
Jeff Root
Updated January 2025
Monthly rates for vehicle insurance can skyrocket in the 15 cities with the highest vehicle theft rates, with costs exceeding $200 per month. This article delves into how these rates vary based on specific city risks and vehicle types, helping you understand the impact of theft rates on your insurance premiums. By examining the top cities for vehicle theft, we reveal essential factors influencing these high costs and how to avoid them. Explore further in our article titled “How does an auto insurance company determine my premium.”

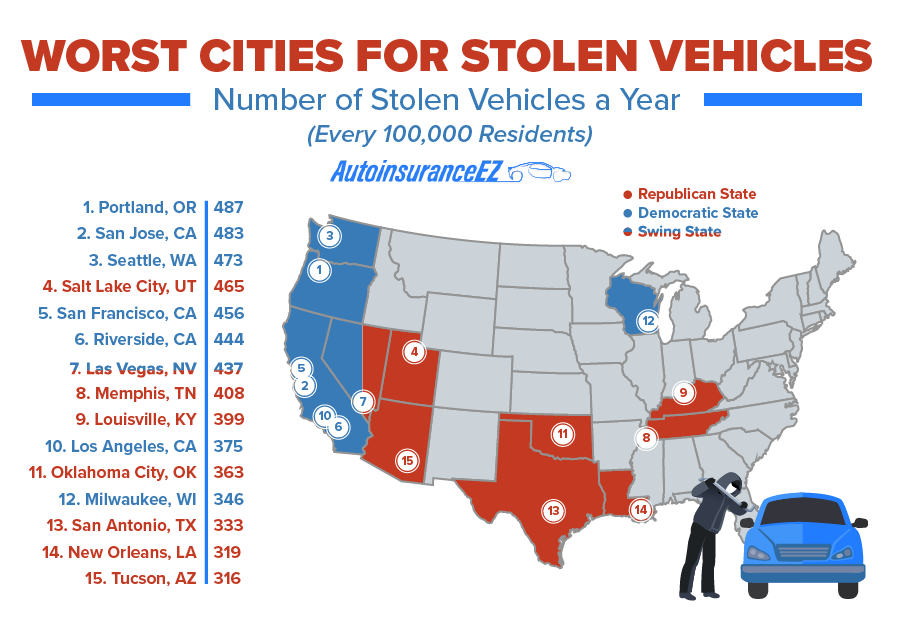
This ranking highlights the 15 cities in the U.S. with the highest motor vehicle theft rates, focusing on those with populations over 1 million. Discover which cities are the car theft capitals of America and the U.S., including the most stolen cars by percentage. View the graphic at the top of the page for details on each city’s annual vehicle theft numbers.
Even in top theft cities, you can find savings. Use our free quote tool by entering your ZIP code for personalized auto insurance quotes.
- Discover the top 15 cities where vehicle theft rates are highest
- Learn how these theft hotspots impact your insurance premiums
- Monthly insurance rates in these areas can exceed $200
Top 15 Cities with the Highest Rates of Vehicle Theft
Ever had that nightmare where you wake up early in the morning, get ready to go to work, and find an empty driveway? If you’re like many Americans, vehicle theft probably isn’t on your mind. It’s a fairly rare occurrence, but when it happens — and it does, with over 450,000 vehicles stolen in 2019 — it can disrupt your entire day.
There’s the hassle: the police reports, the insurance company, the hope, perhaps fleeting, that your car will be recovered. This article covers that trying experience and difficult situation. We also present related articles about car insurance.
Vehicle thefts can raise car insurance rates, adding to the financial burden of that stressful and difficult situation.
Fortunately, there are many ways to find cheap auto insurance rates. Learning about auto insurance discounts is one way you can drop your rate by 15% or more. The best and easiest way to get the cheapest car insurance is to compare live auto insurance quotes from different companies.
A city in blue means it is in a Democrat state, while a city in red means it is in a Republican state. A mixture of red and blue means the city is in a swing state. In addition to the 15 cities with the vehicle theft rates, we’ll cover vehicle thefts in the cities throughout the country, including for specific years. Some topics are:
- Large cities with the highest vehicle theft in 2019
- Vehicle theft stats for 2018 and 2019 in all metro areas
- Vehicles with the highest theft rates
We’ll also touch on vehicle break-ins for certain cities (an example would be San Francisco car break-ins, for instance). The process of filing a claim for a vehicle break-in is similar to filing one for vehicle theft and requires the same type of car insurance. We include, in this article, resources for analyzing auto theft statistics by state and cities ranked by other crimes such as the worst cities for theft.
Finally, we include vehicle theft information from over 300 metro areas for the three years of our study. You might be asking, “What are the car thefts in my area?” Let’s get started.
Free Insurance Comparison
Compare Quotes From Top Companies and Save
The Worst U.S. Cities for Vehicle Theft
Our cities with the highest vehicle theft rates are located in all regions in the country except for the Northeast. They are a mix of red states and blue states as well, with one swing state.
In the chart below, you can see the number of auto thefts for all 15 worst cities, followed by the change in the number of thefts and the change in percentage of thefts from 2017 to 2019. To narrow down the number of cities ranked, we only included cities with 1 million residents or more.
15 Worst Cities for Vehicle Theft: Totals & Change (2017-2019)
| Rank | Metro Area | 2017 | 2018 | 2019 | 3-Year Change (+/-) | And 3-Year Change (%) |
|---|---|---|---|---|---|---|
| 1 | Portland, OR | 12,820 | 12,361 | 10,980 | -1,840 | -14% |
| 2 | San Jose, CA | 10,431 | 10,320 | 8,177 | -2,254 | -22% |
| 3 | Seattle, WA | 18,627 | 18,513 | 18,570 | -57 | 0% |
| 4 | Salt Lake City, UT | 7,006 | 5,450 | 4,548 | -2,458 | -35% |
| 5 | San Francisco, CA | 25,398 | 22,021 | 21,092 | -4,306 | -17% |
| 6 | Riverside, CA | 20,599 | 21,619 | 19,329 | -1,270 | -6% |
| 7 | Las Vegas, NV | 10,272 | 9,945 | 9,059 | -1,213 | -12% |
| 8 | Memphis, TN | 5,030 | 5,775 | 5,668 | +638 | +13% |
| 9 | Louisville, KY | 5,135 | 5,134 | 5,132 | -3 | 0% |
| 10 | Los Angeles, CA | 56,241 | 48,991 | 44,130 | -12,111 | -22% |
| 11 | Oklahoma City, OK | 4,191 | 5,441 | 5,555 | +1,364 | +33% |
| 12 | Milwaukee, WI | 6,587 | 5,612 | 4,167 | -2,420 | -37% |
| 13 | San Antonio, TX | 8,441 | 7,388 | 9,253 | +812 | +10% |
| 14 | New Orleans, LA | 3,823 | 4,258 | 4,085 | +262 | +7% |
| 15 | Tucson, AZ | 3,204 | 3,408 | 3,227 | +23 | +1% |
| Total | All 15 Metros | 197,805 | 186,236 | 172,972 | -24,833 | -13% |
Milwaukee, WI shows the largest percentage decrease out of all 15 cities, while Oklahoma shows the largest percentage increase for those same 15 cities.
Nine of those 15 worst cities are in the West, with cities in the West comprising the seven worst cities in the entire United States.
There is a 171 vehicle theft rate difference between the 15th worst city and overall worst city: Tucson, AZ, at 316 vehicles stolen per 100,000 residents, and Portland, OR, at 487 vehicles stolen per 100,000 residents.
The following graph shows the number of vehicle thefts and vehicle theft rates in the 15 worst cities compared to every city nationwide.
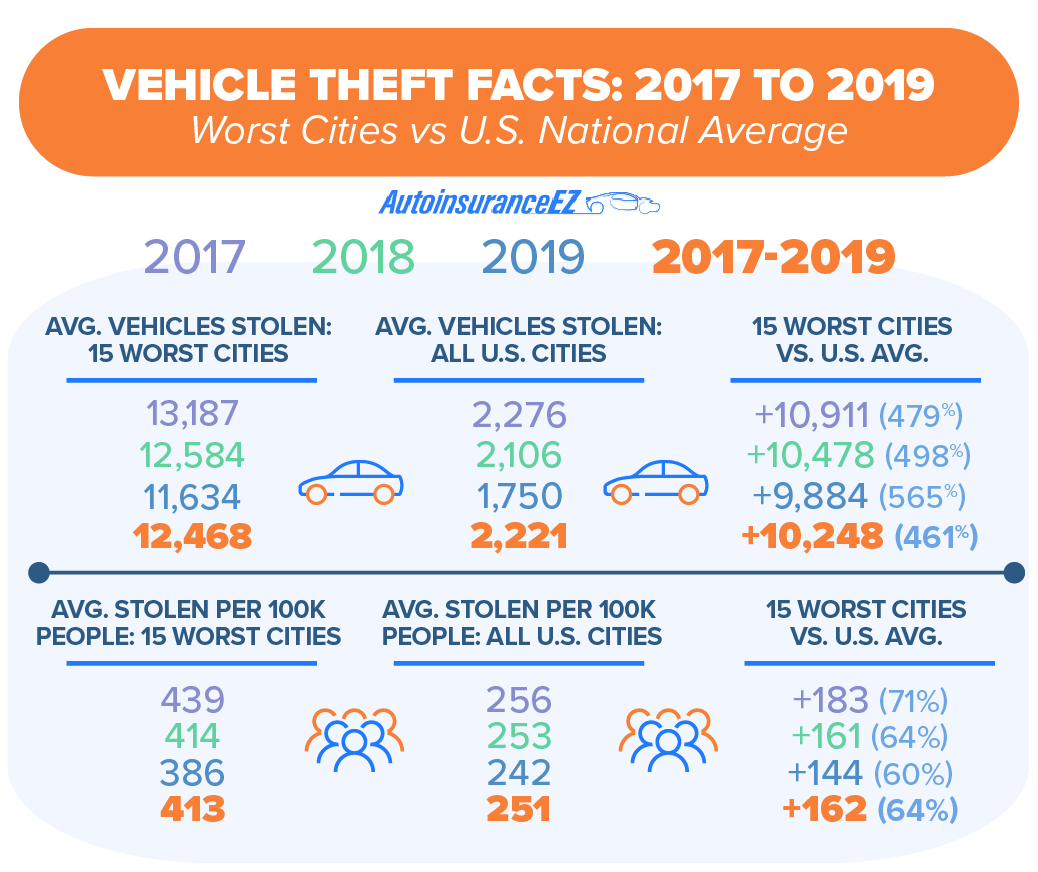
In part, because the worst 15 cities are much larger, 10,000 more vehicle thefts occur there each year compared to all cities nationwide. The bottom half of the graphic that shows vehicle theft rates shows a smaller difference between the worst 15 cities and every city nationwide, but the percentage change still rises considerably.
Thieves steal 162 more vehicles per 100,000 residents annually in the worst 15 cities compared to the average city nationwide.
Between 2017 and 2019, this is a jump of 64 percent. Let’s dive into the ranking now and analyze each of the country’s worst 15 cities for vehicle theft rate. The states at the top may surprise you.
#15 – Tucson, Arizona
- Vehicles Stolen for Every 100,000 Residents: 317
- Total Vehicles Stolen from 2017 to 2019: 9,839
- Metro Population: 1,036,374
Tucson, AZ is our 15th worst city for vehicle theft. Between 2017 and 2019, 317 vehicles were stolen annually per 100,000 residents. The bad news for Tucson: while the annual auto thefts for the 15 worst cities decreased by 12.5 percent from 2017 to 2019, Tucson’s vehicle thefts grew, if only by 1 percent.
What are the top 10 most stolen vehicles? Some cars are more targeted than others. The Arizona Automobile Theft Authority (AATA) shows that four trucks were among the 10 most stolen cars in Arizona, and eight vehicle models were from 2007 or before (ranked most stolen to least):
Top 10 Vehicles Stolen in Arizona (2019)
| Rank | Make | Model | Vehicle Year |
|---|---|---|---|
| 1 | Chevrolet | Pickup | 2004 |
| 2 | Ford | Pickup | 2006 |
| 3 | Honda | Civic | 2000 |
| 4 | Honda | Accord | 1997 |
| 5 | Dodge | Truck | 2001 |
| 6 | Nissan | Altima | 2015 |
| 7 | GMC | Pickup | 2018 |
| 8 | Toyota | Camry | 2007 |
| 9 | Chevrolet | Tahoe | 2001 |
| 10 | Nissan | Sentra | 2007 |
This reflects national trends with Hondas and pickup trucks being among the top vehicles stolen for several years. Often, thieves will pick vehicles to steal depending on how easy it is to steal them and how valuable their parts are for resale. Gain insights by reading our article titled “Honda Odyssey auto insurance rates.”
That’s why many of the most stolen vehicles have model ages dating back to the mid-2000s or older. They have fewer anti-theft devices.
A car break-in and theft victim shares his disbelief that his car would be targeted and that the break-in and theft would happen just a little after he canceled his glass insurance because he couldn’t afford it.
#14 – New Orleans, Louisiana
- Vehicles Stolen for Every 100,000 Residents: 319
- Total Vehicles Stolen from 2017 to 2019: 12,166
- Metro Population: 1,272,230
New Orleans, our 14th worst city in America for vehicle theft, has an annual theft rate between 2017 and 2019 of 319 vehicles per 100,000 residents. It comes with bad news as well: It is just one of five cities out of the 15 worst cities where vehicle theft increased from 2017 to 2019, in this case by 7 percent.
In 2019, a vehicle was stolen every 2 hours and 20 minutes in New Orleans. Police are instructing residents and visitors to lock their doors and use preventative theft devices like a steering wheel lock. Those devices not only prevent vehicle thefts but also can lower your rates if your insurance company offers an anti-theft device discount.
#13 – San Antonio, Texas
- Vehicles Stolen for Every 100,000 Residents: 333
- Total Vehicles Stolen from 2017 to 2019: 25,082
- Metro Population: 2,514,323
San Antonio, TX ranks as the 13th worst city for vehicle theft with an annual rate of 333 vehicles stolen per 100,000 residents between 2017 and 2019. To make matters worse, vehicle thefts have increased by 10 percent from 2017 to 2019.
Vehicle theft in 2017 amounted to a loss of $112 million in Bexar County, where San Antonio is located. It adds that theft happens more around interstates and after 9 p.m. The biggest break-in day is Sunday, in the hours after midnight Saturday.
#12 – Milwaukee, WI
- Vehicles Stolen for Every 100,000 Residents: 346
- Total Vehicles Stolen from 2017 to 2019: 16,366
- Metro Population: 1,575,843
With an annual theft rate of 346 vehicles per 100,000 residents, Milwaukee, WI, ranks as 12th on our list of the 15 worst cities for vehicle theft rates from 2017 to 2019. There is some good news: Motor vehicle thefts declined 37 percent during that period.
In 2017 vehicle robberies and their perpetrators were investigated in Milwaukee (or whatever areas it was). The investigation found that from 2014 to 2016 there was a 20 percent increase in the number of juveniles sent to a detention center for car thefts and armed robberies.
#11 – Oklahoma City, Oklahoma
- Vehicles Stolen for Every 100,000 Residents: 363
- Total Vehicles Stolen from 2017 to 2019: 15,187
- Metro Population: 1,396,377
Oklahoma City, OK is ranked 11th on our list with an annual theft rate of 363 vehicles per 100,000 residents from 2017 to 2019. It faces a serious problem: The number of auto thefts jumped by 33 percent from 2017 to 2019, the worst of all 15 cities in our ranking.
Although newer technology has helped deter car thieves, residents still face challenges, especially during the winter months. A 2019 poll found that about 40 percent of drivers in the United States either “always or sometimes” warm up their vehicles in the winter — leaving them completely unattended in the process.
#10 – Los Angeles, California
- Vehicles Stolen for Every 100,000 Residents: 375
- Total Vehicles Stolen from 2017 to 2019: 149,362
- Metro Population: 13,286,731
Ranked 10th on this list, Los Angeles has an annual theft rate of 375 vehicles per 100,000 residents from 2017 to 2019. Our statistics show good signs: the number of thefts in L.A. declined by 22 percent between 2017 and 2019.
But any celebration is premature. The Los Angeles Police Department Data shows a 60 percent increase in car thefts this year compared to 2019. Much of the blame is on the shelter-in-place order due to the coronavirus pandemic.
L.A.’s number of thefts will increase from 44,130 in 2019 to 70,608 if vehicle thefts are up 20 percent during 2020 due to the pandemic. This comes as overall fatal crashes are down in 2020, as some of the most dangerous times to drive — such as rush hour — are avoided altogether.
This reduces the number of rush hour fatal crashes, which can lower insurance rates overall.
#9 – Louisville, Kentucky
- Vehicles Stolen for Every 100,000 Residents: 399
- Total Vehicles Stolen from 2017 to 2019: 15,401
- Metro Population: 1,285,642
Louisville, KY ranks 9th on this list with an annual theft rate between 2017 and 2019 of 399 vehicles per 100,000 residents. Louisville’s number of vehicle thefts didn’t significantly increase or decrease from 2017 to 2019.
Due to the high number of stolen cars, the Louisville Police Department has issued instructions for residents on how to spot stolen cars. They include looking for broken windows and cars running without keys. In all of this, there are some unique challenges travelers face when visiting Louisville and other cities with high vehicle theft rates.
A traveler who decides to rent a car may be at an increased financial risk if they don’t have a personal insurance policy that covers vehicle theft.
Fortunately, often a loss damage waiver is available from the rental company. This protects the driver from damage to the vehicle or theft. For more information, visit our rental auto insurance FAQ page.
#8 – Memphis, Tennessee
- Vehicles Stolen for Every 100,000 Residents: 408
- Total Vehicles Stolen from 2017 to 2019: 16,473
- Metro Population: 1,347,200
Ranked 8th on this list, Memphis, TN has an annual theft rate from 2017 to 2019 of 408 vehicles per 100,000 residents. There is further bad news: It is just one of five cities in this ranking to have auto thefts increase from 2017 to 2019, with a 13 percent raise.
Memphis suffers from another problem in 2020. Various news reports share that a gang of car thieves, most of whom are young adults or kids, is terrorizing dealerships, going on high-speed joyrides, and often stealing eight cars or more per heist.
#7 – Las Vegas, Nevada
- Vehicles Stolen for Every 100,000 Residents: 437
- Total Vehicles Stolen from 2017 to 2019: 29,276
- Metro Population: 2,234,147
Las Vegas, NV is ranked 7th on this list with an annual theft rate from 2017 to 2019 of 437 vehicles per 100,000 residents. The good news is that auto thefts in Las Vegas dropped 12 percent from 2017 to 2019. For further details, consult our article named “best North Las Vegas, NV auto insurance.”
While Nevada has harsh punishments for people convicted for vehicle theft, Las Vegas continues to have problems, ranking even as the worst city for car theft rate as far back as 2006.
#6 – Riverside, California
- Vehicles Stolen for Every 100,000 Residents: 444
- Total Vehicles Stolen from 2017 to 2019: 61,547
- Metro Population: 4,617,887
No stranger to vehicle thefts, Riverside, CA ranks 6th on this list. It has an annual theft rate between 2017 to 2019 of 444 vehicles per 100,000 residents, with over 61,500 vehicles stolen during that same period. The trend is positive, however, with the number of vehicles stolen declining by 6 percent from 2017 to 2019.
Riverside’s tourist-heavy areas and geographical features contribute to frequent thefts. Additionally, lower penalties for criminals reduce jail time as a deterrent, giving thieves more freedom. With some of the biggest police budgets by city, Riverside faces ongoing challenges in managing these issues effectively.
#5 – San Francisco, California
- Vehicles Stolen for Every 100,000 Residents: 456
- Total Vehicles Stolen from 2017 to 2019: 68,511
- Metro Population: 4,729,548
San Francisco has had problems with vehicle theft in recent years and ranks 5th on this list with a theft rate of 456 vehicles per 100,000 residents. Fortunately, it is abating. The number of car thefts in San Francisco dropped by 17 percent from 2017 to 2019.
This 17 percent drop in vehicle thefts for San Francisco is the fifth-largest of all 15 cities in our ranking. The California Highway Patrol shared that in 2018, Hondas with models 2000 or older were the most stolen vehicles in the cars and personal trucks/SUVs categories.
This can affect how much a Honda owner will pay on auto insurance. For instance, Honda Civic insurance rates are higher due to the car’s high theft rates. While a driver can lower their rates through discounts or telematics systems, it is something to consider when purchasing a new vehicle.
#4 – Salt Lake City, Utah
- Vehicles Stolen for Every 100,000 Residents: 465
- Total Vehicles Stolen from 2017 to 2019: 17,004
- Metro Population: 1,219,447
Ranked 4th on this list, Salt Lake City, UT has an annual theft rate between 2017 and 2019 of 465 vehicles per 100,000 residents. There is encouraging news, though: Car thefts declined by 35 percent during that same period.
This continues a trend for the last few years. But residents still face a challenge in 2020 due to the coronavirus pandemic. Because people are driving less and their cars sit idle on the streets or in driveways, they are easy targets for thieves.
#3 – Seattle, Washington
- Vehicles Stolen for Every 100,000 Residents: 473
- Total Vehicles Stolen from 2017 to 2019: 55,710
- Metro Population: 3,928,751
Ranked 3rd, Seattle has an annual theft rate between 2017 and 2019 of 473 vehicles per 100,000 residents. Unlike most of the 15 worst cities, Seattle’s numbers don’t decline significantly comparing from 2017 to 2019.
It gets even worse. There have been 27 percent more vehicle thefts in 2020 compared to 2019. The blame is on the coronavirus pandemic, which has kept people indoors and made their cars easy targets.
#2 – San Jose, California
- Vehicles Stolen for Every 100,000 Residents: 483
- Total Vehicles Stolen from 2017 to 2019: 28,928
- Metro Population: 1,996,077
San Jose, CA is ranked 2nd on this list with an annual theft rate from 2017 to 2019 of 483 vehicles per 100,000 residents. It has a positive trend, however, with auto thefts dropping 22 percent from 2017 to 2019.
One of these targeted neighborhoods is Fremont. In 2020 car thieves broke into 30 cars in just one night in the Fremont neighborhood in north San Jose.
You might be asking: How do I protect myself financially if my car is stolen? After all, a stolen car can run into tens of thousands of dollars, and even if it recovered, it may be totaled or damaged significantly. The auto insurance that covers theft is called comprehensive insurance. Learn more about how it can protect you if a thief steals your car at our comprehensive vs. collision insurance page.
#1 – Portland, Oregon
- Vehicles Stolen for Every 100,000 Residents: 487
- Total Vehicles Stolen from 2017 to 2019: 36,161
- Metro Population: 2,474,592
Where are the most carjackings? Portland is ranked the worst city in the country for vehicle theft rate. It averaged an annual 487 stolen cars per 100,000 residents between 2017 and 2019. There is one bright spot for Portland, though: the number of thefts dropped 14 percent from 2017 to 2019.
Cities with higher vehicle theft rates, averaging $150 per month in coverage costs, show a significant increase in auto insurance premiums due to the higher risk of theft.
Kristen Gryglik Licensed Insurance Agent
The Portland Police Department has set up a page sharing monthly vehicle theft statistics, including 2020 data. Highlights show that Hondas are the most stolen brand. Thieves in Portland have stolen 950 more Hondas compared to the next vehicle brand from January 2020 up to August 2020.
Thefts occur the most between 6 p.m. to midnight, and thieves target the Hazelwood neighborhood in the northeast and southeast parts of Portland the most.
Per Capita Vehicle Theft Rates for All Metros in America
2017-2019 Vehicle Theft Fast Facts:
- Annual vehicles stolen for every 100,000 residents nationwide: 230
- Three-year total number of vehicles stolen nationwide: 1,462,037
The ranking forthe highest car theft cities included just the 15 worst cities for vehicle theft rate, with only cities having 1 million or more residents qualifying for the list. Now, let’s take a look at all metros in America.
The interactive U.S. map below shows the annual vehicle theft rate for all metros between 2017 and 2019. Hold your cursor over a bubble or press down on a bubble with your finger to see a city’s specific statistics.
Because every city is represented, regardless of population, we see a new top 10 forming with some familiar cities. Albuquerque, NM, Bakersfield, CA, Anchorage, AL, AK, and Modesto, CA, are cities that routinely have the highest vehicle theft rates when all city populations are considered.
Albuquerque ranks as the city with the highest auto theft rate with an average of 831 cars stolen per year per 100,000 residents. This is 601 more cars stolen every year per 100,000 residents than the nationwide average.
You might see one city that didn’t make our ranking of most car thefts by city that had a population of over 1 million: Denver, CO. We declined to include this city because our source only had data on it for one year, compared to two or three years for other cities.
Total Annual Vehicle Thefts for All Metros Nationwide
The following graph shows the number of vehicle thefts per metro area. If you place your cursor over a city’s bubble or press down on it with your finger, you’ll find the city’s number of vehicle thefts for each of the years in our study: 2017, 2018, and 2019. You’ll also see three-year vehicle theft totals and average annual population.
As the map shows, the places that have the most vehicle thefts in America are often the nation’s most populous cities. Still, as we’ve seen in the graphic about vehicle theft rate per capita, even though these are the most populous cities, the rates for vehicle theft are much higher than the nationwide average. Learn more about our “Geico vs. Nationwide” for a broader perspective.
Green Bay, WI had the lowest number of vehicles stolen between 2017 and 2019 with 530. Los Angeles had the highest number at over 149,000. To add context to these numbers, we compared them to the city’s population and created the per capita number in the graph in the previous section.
Click on your city’s bubble to find out its vehicle theft statistics and how much you’re in danger of having your vehicle stolen based on our three-year study.
Free Insurance Comparison
Compare Quotes From Top Companies and Save
Personal Accounts and Advice: Vehicle Theft & Recovery
We’ve seen the statistics and know just how badly vehicle theft is in the 15 worst cities. Now, let’s hear from four experts who talk about the experience of having your car stolen and how you can prevent it.

“Two years ago, my car was stolen in Irving, TX. I had used the car barely 13 months and filing an insurance claim wasn’t something to think twice about. I acted instantly. I called the police, filed a first information report, and immediately called the insurance company to give some basic information such as the car details, policy number, and more.
My claim was approved days later by the police after a series of filing and submitting forms to the insurance company. It took almost a month for the insurance company to reimburse me after the formal process was complete. Immediately after it dawned on me that my car had been stolen, I was shaken up, had uncontrollable fear, consternation struck, and I almost fainted. It was literally the most botched situation I ever experienced.
Apart from the obvious ways of avoiding auto theft such as keeping doors and windows shut, I would advise car owners to use anti-theft devices such as gearshift lock and steering wheel lock, not to mention parking in well-lit and highly secured areas. Paying for anti-theft devices is absolutely great and worth the bucks.
Well-sophisticated anti-theft devices keep you updated on what’s going on with your car while some use alarms which can easily scare carjackers.
Had I fixed my car with one, the theft wouldn’t have occurred. There are a lot of ways to deter carjacking and theft in both small and big cities including, but not limited to:
- Ensuring CCTV cameras work effectively — more so in parking areas
- Making sure the authorities have a sophisticated security system in parking areas
- Above all, it’s the car owner’s responsibility to ensure their vehicles are safe.
Thankfully, where I live and do most of my businesses, Irving, most parking areas are equipped with good systems to deter car theft. If it does happen, it becomes comparatively easy to trace the perpetrator.”

Umer Brown is the founder of WarnockAuto and an automotive expert.
His site provides in-depth assessments and reviews of automobiles.
“My vehicle was stolen in broad daylight in one of the Denver suburbs this summer. Police never came out to take a report, only took it by phone. A few weeks later, my car was recovered in a nearby hotel parking lot. It had a broken ignition, tons of stolen mail inside, and reeked of cigarette smoke.
Police had been absolutely useless and after the car spent weeks in the impound lot, where they were processing it for fingerprints, they called me and asked if I knew the names of people that they linked fingerprints to. I did not.
Nobody has been arrested for stealing my vehicle to this day, with both police and my apartment complex not helping a great deal.
This was an absolute nightmare, and from spending $1,600 out of pocket on repairs to doing my own research, I found out that Denver has a high auto theft rate. There’s even a Facebook group dedicated to people who are looking for their stolen vehicles or posting found cars and motorcycles.
I have a bar on my steering wheel, and I’m always wary of where I park since my vehicle was stolen.
I also should mention that the vehicle was stolen from my apartment complex. My biggest tip to everybody living in or moving out to Denver is to put a GPS tracker on their vehicle and otherwise make sure that it is secure.
Just to add, the apartment complex where I live was absolutely useless in helping me. The management couldn’t identify a vehicle on their camera footage from the front gate.”
— Anonymous travel site owner
“With car theft, there are two things you need to consider. First, if the city you are traveling to is considered to have high rates of auto theft like multiple cities in California and New Mexico, for example, consider what percentage of all people owning a car make up the statistics.
It might be that because so many people own a car in this region the numbers seem high but aren’t proportionally that much. Second, research the safety of the place you are traveling and the number of cars they have. The dangers of motor vehicle theft could be higher if the people aren’t used to seeing cars around.
Motor vehicle theft can really impact people a lot, however, no one is as impacted as full-time travelers. I know people who travel in a converted van who had it stolen. They not only live in it, meaning all of their things are in there and that is their accommodation, but the van is their means of travel as well.
It was a particularly frustrating situation because the local police weren’t very cooperative. I think everyone felt uneasy afterward.
I now use additional anti-theft devices in my van when traveling. Even if it doesn’t prevent the theft it will make it more difficult for the police to refuse to work the case.
Preventing car robberies isn’t so much a case for stopping the robbery happening but more about making sure the robbers don’t have an easy way of selling it. Documentation and car dealers are monitored closely and after a little while thieves realize that it is just not worth the risk.”

Will Hatton is the founder and CEO of The Broke Backpacker.
Will and his team design (and test) adventure itineraries and create travel guides.
“People steal for different reasons. When it comes to stealing vehicles, the two most common reasons for the theft are to strip the car down and sell its parts — a chop shop — and joyriding. As we see in various news reports, it’s often young adults and juveniles that are stealing vehicles, often in dramatic ways as seen in the vehicle theft ring in Memphis, TN.
Police combat vehicle theft through investigation and awareness, with police departments sometimes reclaiming up to 80 percent of stolen vehicles and engaging in public campaigns to educate residents on how to keep their cars safe.
The national trend for auto thefts has gone down since 2019, though it may be on the rise again due to the coronavirus pandemic. Some publications in our 15 worst cities show that the coronavirus has led to an increase in thefts, often 20 percent or higher since last year.
“I had a friend who drove a Honda Civic which was stolen and recovered by police on three different occasions. Apparently, Honda Civics are among the easiest vehicles to hotwire, and they top the list of most commonly stolen vehicles in America. It’s likely that some car thieves simply drive around town looking for Honda Civics in particular. While some other vehicles are more valuable, Civics are common so there is a demand for parts.
Many stolen cars are taken to chop shops where they are disassembled and sold piece by piece to other Honda Civic owners looking for components for repairs. My friend was lucky that his stolen Honda was recovered by police, but the headache, the uncertainty, and the sense of invasion is something that no one should have to go through.
Witnessing my friend struggle with a commonly stolen vehicle type inspired me to keep that in mind when shopping for new vehicles. Among the many factors I research in regards to a new car is:
I always check how often a particular make and model is stolen statistically while researching a new vehicle to buy.
In fact, crime statistics are what influenced my decision to buy a Nissan Sentra instead of a Toyota Camry. According to the latest data I could find, Toyota Camrys are stolen at a rate of 0.3 percent, totaling about 1,110 total thefts per year on a national scale.
Meanwhile, Nissan Sentras are stolen at a rate of just 0.2 percent, and since there are few of them on the road, only about 440 annual thefts are reported.”

Jake McKenzie is the content manager at Auto Accessories Garage.
This family-owned business sells automotive parts and accessories.
Methodology: Determining the Worst Cities for Vehicle Theft
For this three-year study, we looked at two sources for data:
- The Federal Bureau of Investigation Uniform Crime Report
- The U.S. Census Bureau American Community Survey
We gained the number of vehicle thefts in each metro for the years 2017, 2018, and 2019 from the FBI’s Uniform Crime Reporting Program. From the Census Bureau’s America Community Survey, we found population data for the corresponding metros.
For each metro area, we found out the number of vehicle thefts per year per resident of that city. We then multiplied that number by 100,000 to create a number of vehicle thefts per 100,000 residents.
We used this as the basis of our ranking. For the 15 cities with the highest vehicle theft rates, we limited the cities to those with 1 million residents or more. Denver, which had the highest theft rate overall of that group, was eliminated because there was only one year of data available.
You can protect yourself financially from having your car stolen through comprehensive insurance. Find the best auto insurance quotes today by plugging your ZIP code into our free quote tool. It’ll give you the best rates in your area, specifically for you and your insurance needs.
Frequently Asked Questions
What is the No. 1 stolen car in America?
Although the No. 1 stolen car in America varies year by year, there are a few makes and models that appear consistently in each ranking. Honda’s models that are typically made before 2006 are common targets of these. Pickup trucks like the Ford F-150 are also stolen frequently. Two of the main factors a thief looks for when stealing a vehicle is how easy it is to steal it and how profitable the vehicle parts are when they are resold.
What cars are easiest to steal?
Old Hondas (models 2000 and before, especially) are known as one of the easiest — or at least most stolen — makes each year. The reason is that Honda parts are always in demand, and the earlier models are rumored to be one of the easiest cars to hotwire, removing the need for a thief to have a key.
Where do most cars get stolen?
California is the state with the most cars stolen, having four cities within the worst 15 cities for vehicle theft rate: Los Angeles, Riverside, San Francisco, and San Jose. Vehicle thefts between 2017 and 2019 for all of those four cities combined amounted to 308,348.
How does insurance handle a stolen car?
If your car is stolen, you’ll generally need to have a comprehensive insurance policy to be reimbursed. The claim process is similar to filing a claim for an auto accident but includes a couple of differences. First, you’ll need to file a police report and then reach out to your company.
If your car is totaled when the police find it or it never is found, you should receive a payment for the actual cash value of the vehicle before it was stolen, minus your deductible.
Is it harder to steal newer cars?
Generally, new cars are more difficult to steal due to the advancements of anti-theft technology compared to models that were rolled out a decade or earlier. However, new cars are often targeted because stealing them is more lucrative. Due to their price tag and the value of their parts, thieves can make a great deal more stealing newer cars than older cars.
What vehicles get stolen the most?
The vehicles that get stolen the most are small, older vehicles from the turn of the century (1999, 2000, etc) and pick-up trucks. The reason is that the parts for these vehicles are always in demand, so thieves can make money by stripping the stolen cars down and selling the parts on the black market.
What color car gets stolen the most?
According to various studies, green cars are the most popular target for thieves, though there is no reason known at this moment as to why.
What is the safest car color?
White cars are involved in the fewest accidents compared to vehicles of other colors. Part of the reason might be that white cars are very visible and more visible at night than other vehicles, which is the most dangerous time to drive.
Can a Tesla be stolen?
Yes, a Tesla can be stolen if a hacker gains access to the car’s electronic system. At that point, the hacker can then move the car where they want to.
Are cars with push-button starts easy to steal?
Cars with a push-button are not necessarily easier to steal. Thieves might need advanced technological “gadgets” to gain access to the car before being able to just push the “start button.”
What car has the most catalytic converters stolen from it?
What is the hardest car to drive?
Which car is the fastest in the world?
What is the car theft capital of the world?
What is the list of stolen vehicles in Albuquerque?
Are Nissan Sentras easy to steal?
Does AutoAccessoriesGarage offer cash back?
What is the car theft capital of the USA?
What is the situation with car theft in Seattle?
What is the rate of car theft in Las Vegas?
How prevalent is car theft in New Orleans?
What is the car theft rate in Charlotte, NC?
Which city has the most carjackings?
Which city has the most stolen cars?
What is the rate of car break-ins in Los Angeles?
What is Louisville’s crime rate ranking?
What is the frequency of carjackings in Memphis?
How are metal thieves affecting American cities?
What is the rate of car break-ins in Milwaukee?
What is the theft rate for Honda Accords?
What are the car theft statistics in Houston?
What are the most stolen cars in Denver?
What is the crime rate in Plymouth, NC?
What is the crime rate in Portland, TN?
What is the crime rate in Portland, TX?
How is Salt Lake City’s crime rate ranked?
Where can I find a map of car break-ins in San Francisco?
What is the list of stolen cars in Washington?

Get a FREE Quote in Minutes
Insurance rates change constantly — we help you stay ahead by making it easy to compare top options and save.

